Get in touch with UDTECH Company


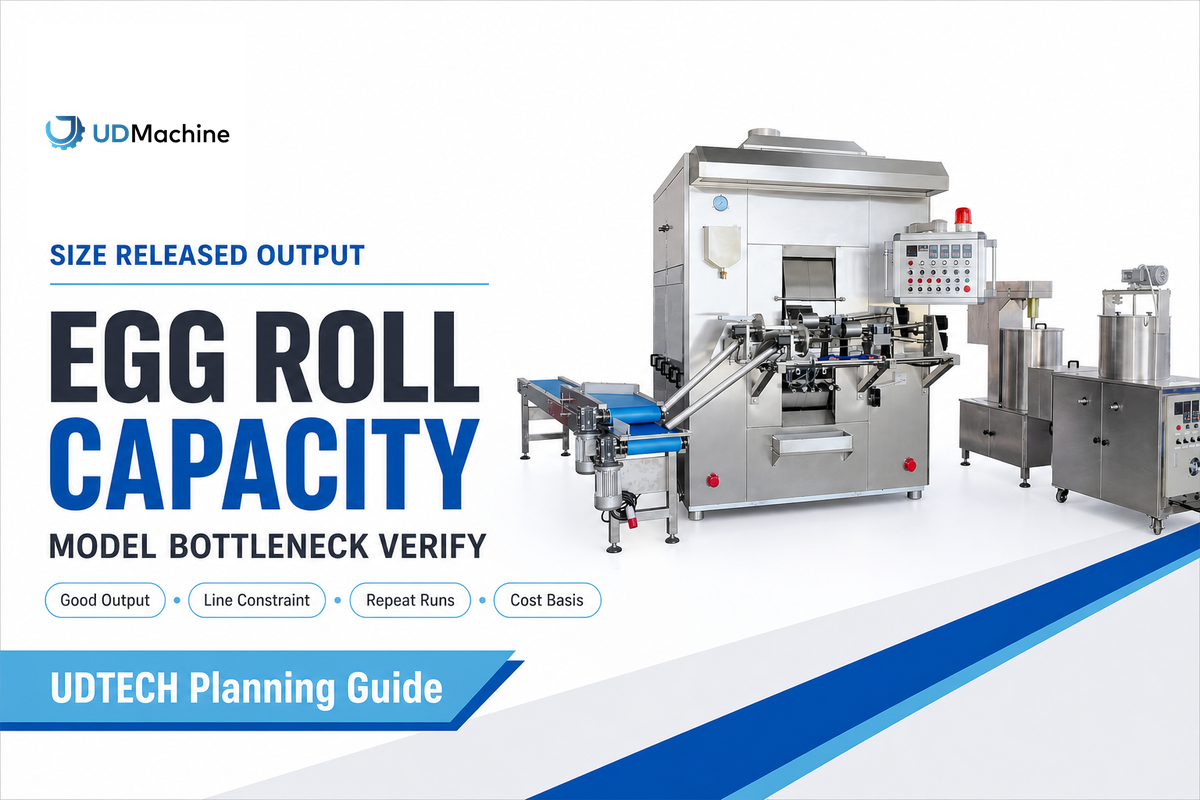
Egg Roll Machine Capacity Planning is the process of sizing equipment from the released, packaged rolls an order requires, not the fastest cycle shown in a brochure. Effective food production capacity planning establishes a product, assesses each type of loss, checks the entire production line, and sizes the equipment according to peak demand.
Updated September 2026
Egg Roll Machine Capacity Planning converts a product-specific demonstrated rate into released good pieces per hour and week. Use measured availability, run-rate performance, first-pass release yield, scheduled hours, and the slowest line station. Round the required machine count up, then confirm it through witnessed and repeated runs.
Planning Snapshot
| Planning unit | Released good pieces per hour and per scheduled week |
| Product scope | Filled savory egg rolls or spring rolls with a defined wrapper, filling, size, cooking process, and pack |
| Core equation | Demonstrated rate x availability x performance x first-pass release yield |
| Line constraint | Lowest sustainable released-good rate across all connected stations |
| Proof required | Witnessed output plus repeated-run stability evidence under agreed conditions |
Key points
- Short station stops don’t always reduce end-of-line output when a buffer absorbs them.
- Sweet wafer or cigar rolls and filled savory rolls require different process assumptions.
- Good pieces must meet commercial quality and the applicable food-safety release conditions.
- One short test proves observed output, not sustainable capacity across products and shifts.
Plan for Good Output, Not Nameplate Speed
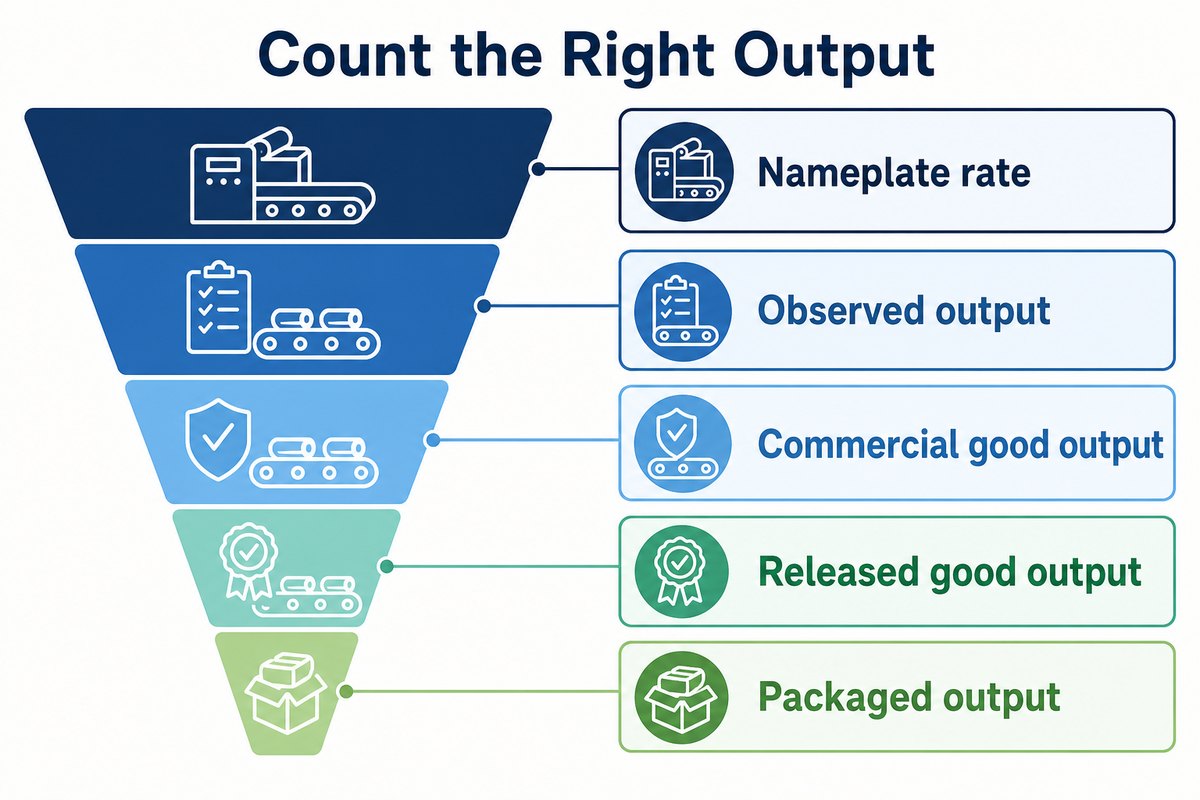
Machine capacity becomes relevant only once every item has a fixed boundary. Nameplate rate defines a nominal cycle; observed output counts all items made; commercial good output filters out defects; released good output satisfies the applicable food safety criteria; packaged output defines what can be shipped.
ISO’s public page for ISO 22400-1:2014 describes an industry-neutral framework for manufacturing performance indicators across batch, continuous, and discrete industries. It does not publish a universal utilization target. The useful lesson is to define the numerator, denominator, time window, and excluded events before comparing two egg roll machines.
A NIST manufacturing case outlines the collection of cycle counts, production availability data, and defective-part counts for overall equipment effectiveness. The case also contains availability, performance, and quality discussions. Those inputs define a measurement framework. They don’t justify the copying of a percentage from another plant.
Key takeaway
Use one capacity definition in the request, supplier test, production plan, and purchase contract: released good pieces within an agreed time window.
Define the Product Before Comparing Capacity
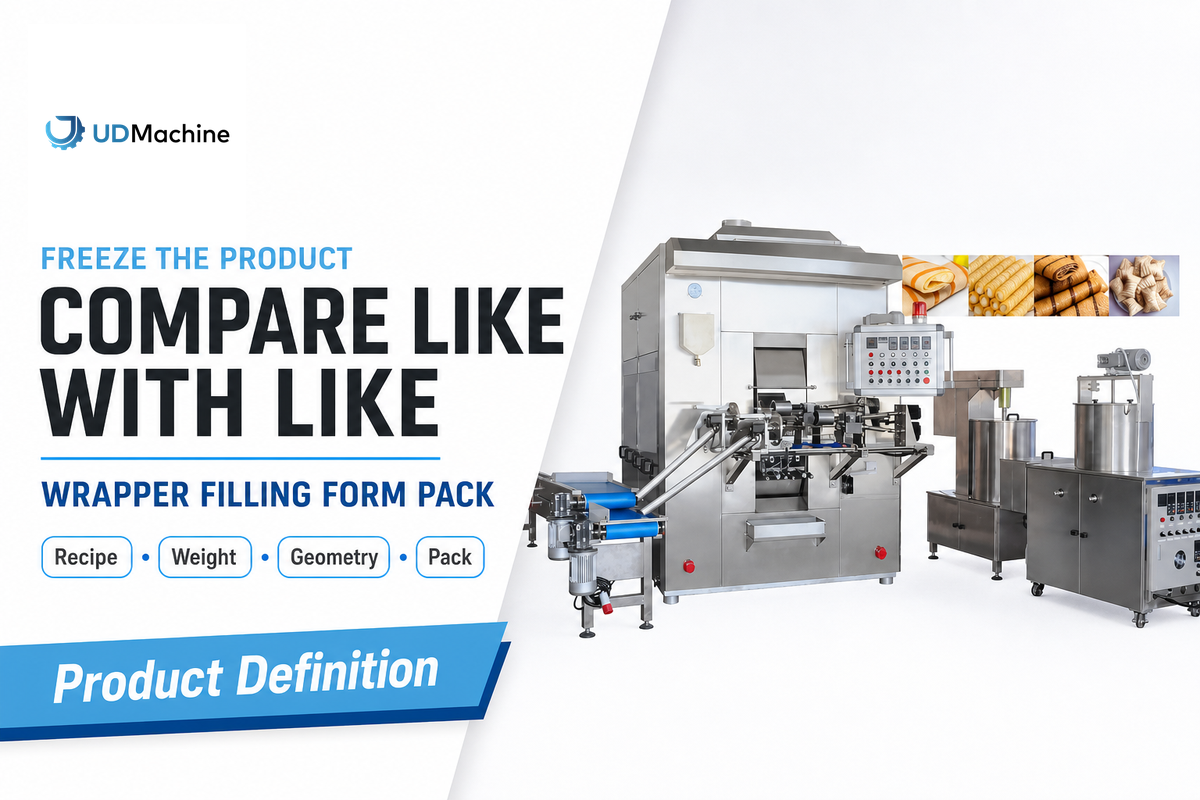
Capacity quotes are comparable only if all suppliers have the same product definition. Wrapper size and dough behavior, filling recipe and weight, final shape, cooking conditions, inspection criteria, and the final pack can affect both the production rate and the release yield.
For comparative reasoning, the page for ANKO’s ER-24 product mentions a maximum 2,400 pieces per hour for products weighing 65-75 g. It cites specification/recipe/product dependency for capacity. This isn’t a UDTECH specification, and it isn’t the industry average.
This filled-product production rate must be kept separate from the rate of production for sweet wafer rolls. Wafer rolls are rolls that are formed when baked as a thin sheet. A machine that produces egg rolls will combine a sheet with filling before frying. You can learn more about this distinction in the wafer roll versus spring roll machine guide.
Searching for labels like “automatic egg roll machine” or “industrial egg roll machine” won’t answer this question. The quote needs a product description and a process definition.
Product Quality and Consistent Quality Inputs
For food manufacturers, product quality and consistent quality require stable product sizes, controlled ingredient preparation, and a product consistency rule that suppliers can test.
| Input | Record | Why it changes capacity | Limitation |
|---|---|---|---|
| Wrapper material | Recipe or supplier code | Handling and sealing behavior | Do not substitute during the test |
| Wrapper dimensions | Width, length, thickness | Fold travel and finished size | Use measured values |
| Filling recipe | Ingredients and condition | Flow, deposition, and sealing | Control temperature and batch |
| Filling weight | Target and tolerance | Depositor cycle and reject risk | Confirm by weighing samples |
| Finished geometry | Length, diameter, fold | Tooling and station timing | One format per comparison row |
| Cooking process | Fry, bake, or other method | Downstream residence time | Validate the actual process |
| Release criteria | Defects and safety limits | Defines the good-piece count | Buyer approval required |
| Pack format | Count, tray, bag, or carton | Sets packing station demand | Include inspection step |
| Product mix | Units by stock-keeping unit | Creates changeover demand | Model peak week, not average only |
Build a Weekly Good-Output Capacity Worksheet
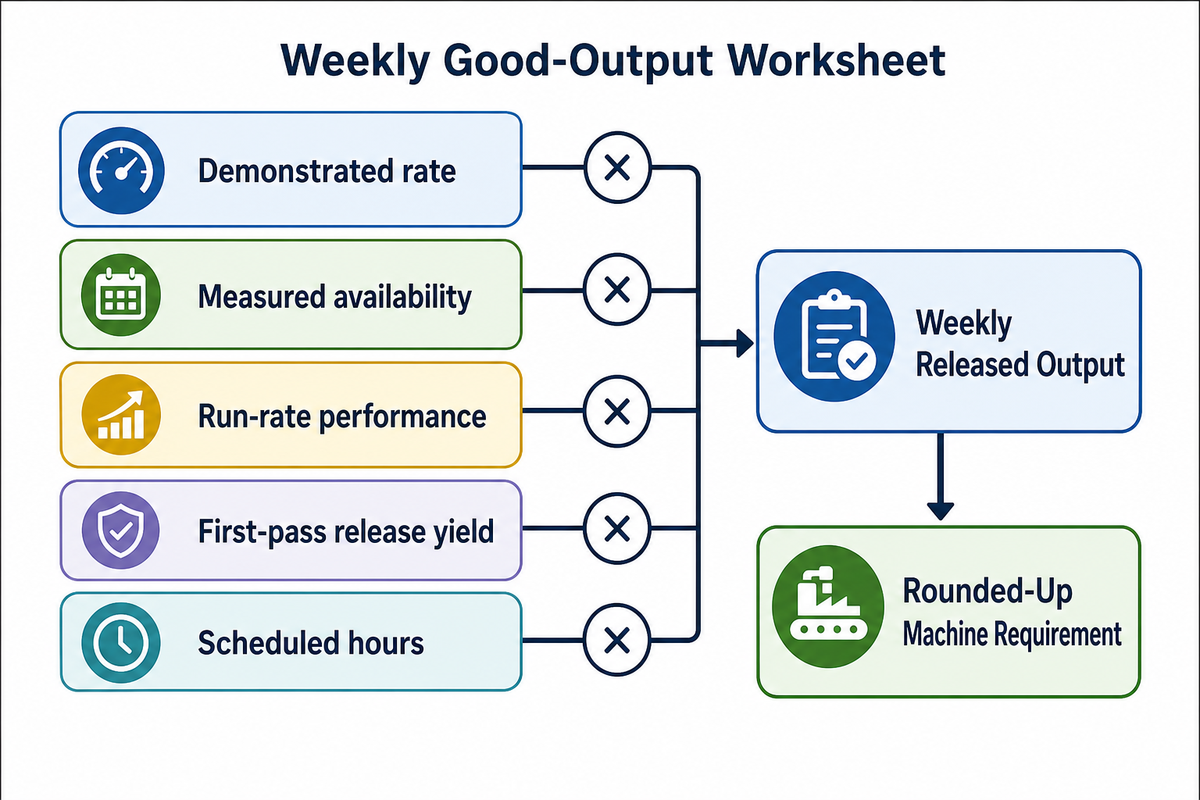
Weekly capacity models multiply a product-specific demonstrated rate by measured availability, run-rate performance, first-pass release yield, and scheduled hours. Divide the peak demand by this number and round up. So replace all sample inputs with the current plant’s or supplier’s test data.
Good-Output Capacity Worksheet
The Good-Output Capacity Worksheet turns five controlled inputs into one comparable planning result.
Released good pieces/hour = demonstrated pieces/hour x availability x performance x first-pass release yield
Weekly released good pieces = released good pieces/hour x scheduled production hours
Required machines = peak weekly demand / weekly released good pieces per machine, rounded up
Worked example: assume a demonstrated rate of 2,000 pieces/hour, 85% availability, 90% run-rate performance, 97% first-pass release yield, and 40 scheduled production hours. The result is 2,000 x 0.85 x 0.90 x 0.97 = 1,484.1 released good pieces/hour, or 59,364 pieces/week. A 90,000-piece peak week requires 90,000 / 59,364 = 1.52, so the plan rounds up to two machines.
| Scenario | Availability | Performance | Release yield | Schedule | Weekly released output |
|---|---|---|---|---|---|
| Cautious case | 75% | 85% | 95% | 32 hours/week | 38,760 pieces/week |
| Base case | 85% | 90% | 97% | 40 hours/week | 59,364 pieces/week |
| Higher measured case | 88% | 92% | 97% | 48 hours/week | 75,390 pieces/week |
| Extended schedule | 85% | 90% | 97% | 80 hours/week | 118,728 pieces/week |
These four rows are sensitivity cases, not expected plant results. Holding the demonstrated rate at 2,000 pcs/hour illustrates how measured losses and scheduled time would affect the plan. Each value must be replaced with actual data and then equipment should be selected.
Complete this capacity modeling before finite production scheduling. Otherwise, a detailed schedule can allocate demand to output that the connected line has never demonstrated.
Production Planning for Production Capacity
Production planning should connect production capacity, production efficiency, and each production process step to released output rather than nominal speed.
Released output has defined constraints. The FDA’s HACCP principles and application guidance distinguish food safety critical limits from operational limits. Applicable controls depend on the product and hazard analysis, but pieces that fall outside of those limits should not be considered sellable capacity, even if their dimensions are acceptable.
Measure Changeover, Sanitation, and Repeated-Run Stability
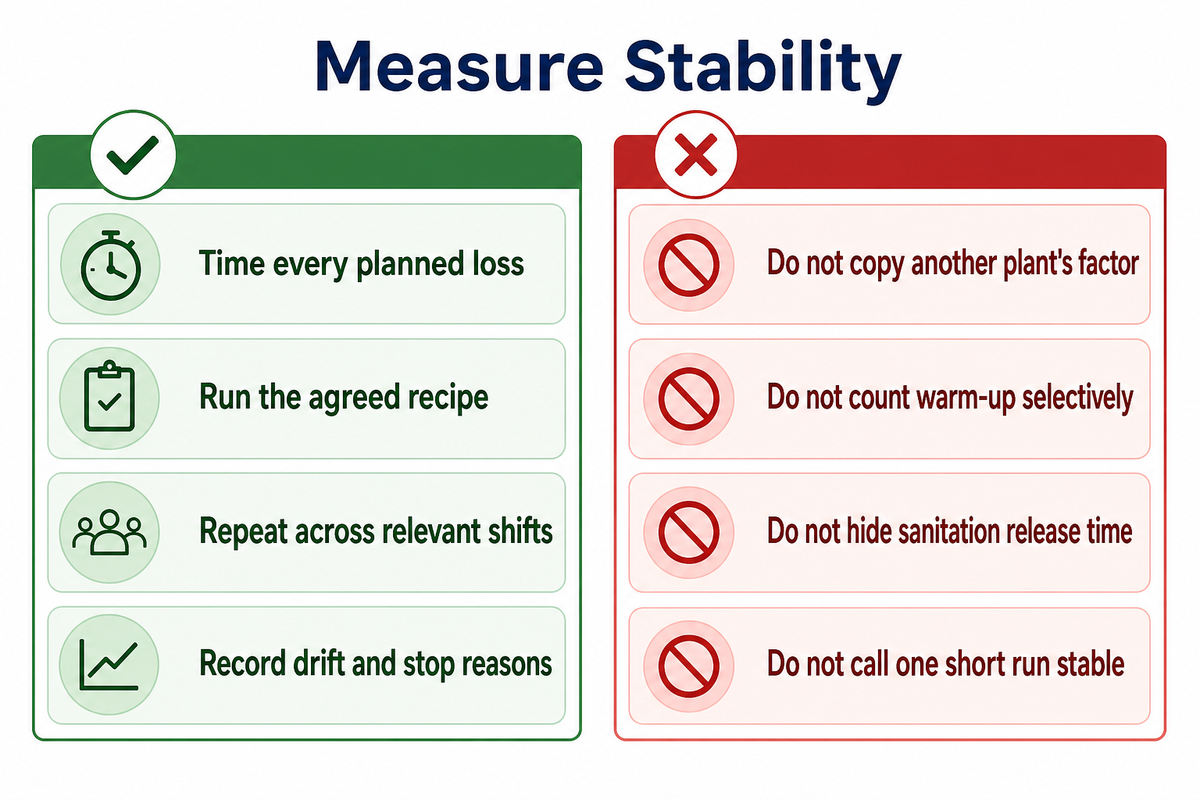
Recorded warm-up, product changeover, cleaning, sanitation release, planned maintenance, and stops convert scheduled hours to production hours. One verified run establishes an observed rate under stated conditions. Repeated runs of agreed products or shifts provide stronger evidence of the sustained rate.
A peer-reviewed ready-meal factory case reported a changeover reduction from 29 min to 20 min after specific process changes. The plant and intervention aren’t comparable to egg roll production. Due to the nature of the changes, the values presented aren’t default values for planning. The case provides a good reason why teams should time their own current state before assigning changeover loss.
NIST’s process-stability guidance says capability discussion follows demonstrated stability over time. Its sampling discussion is more general guidance for manufacturing rather than an egg-roll acceptance threshold. The procurement agreement must establish repeated-run windows, product mix, warm-up treatment, and drift before signing.
Food Manufacturing Optimization and Wastage
Food manufacturing optimization should reduce measured wastage while preserving the agreed product, sanitation release, and repeated-run evidence boundaries.
Do
- Time every planned loss
- Run the agreed recipe
- Repeat across relevant shifts
- Record drift and stop reasons
Do not
- Copy another plant’s factor
- Count warm-up selectively
- Hide sanitation release time
- Call one short run stable capacity
Map the Hidden Line Bottleneck and Hold Time
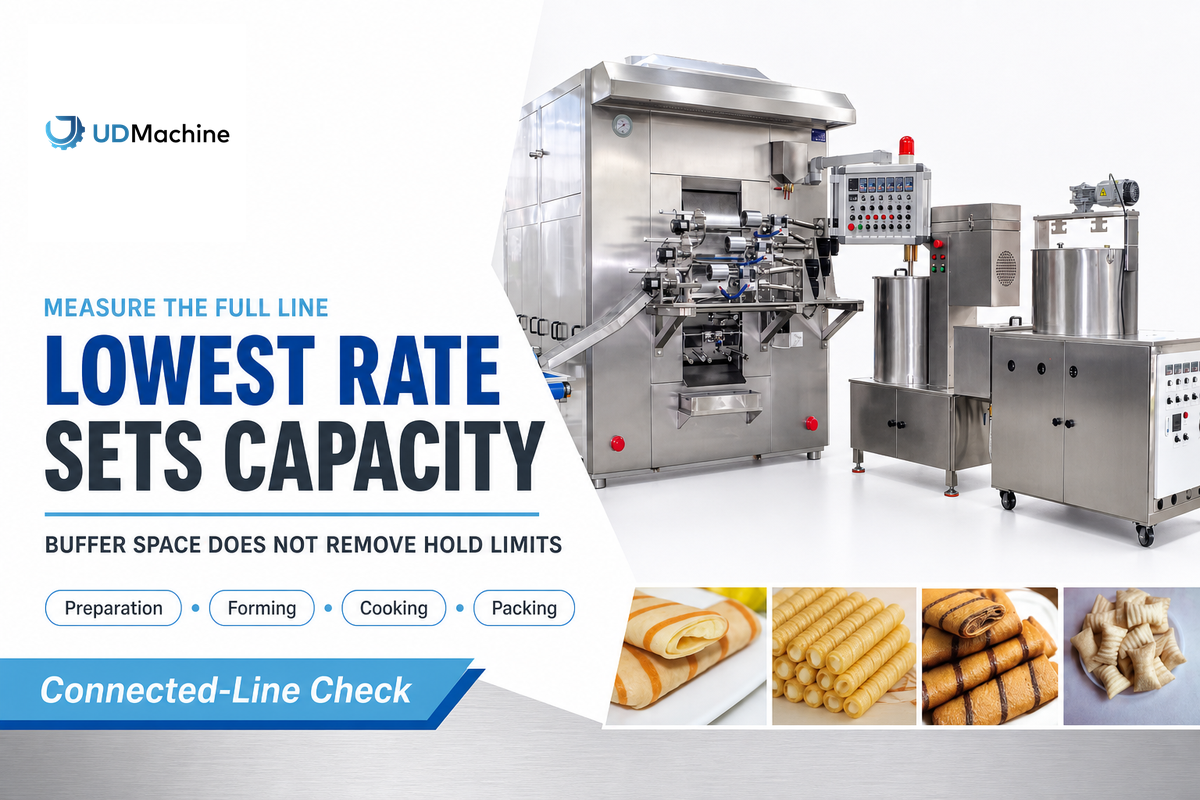
The capacity constraint is not necessarily the forming or rolling machine. The station with the lowest effective released-good rate sets the sustainable line rate across preparation, filling, forming, cooking, inspection, cooling or freezing, packing, and sanitation, subject to buffer residence and time-temperature limits.
Line Bottleneck and Hold-Time Map
The Line Bottleneck and Hold-Time Map pairs each station’s effective rate with the condition that can invalidate its apparent spare capacity.
An Eng-Tips manufacturing discussion describes a 13-station line where short station stops didn’t impact output, as intermediate queues maintained station flow. This example is from the automotive industry and not food processing, but the same measurement would apply – don’t add the total minutes each station was stopped and call that line downtime.
Food Engineering’s packaging report also treats downstream packaging as a possible production constraint. Its commercial examples aren’t egg-roll benchmarks, but the line-level question is relevant: can the packer sustain the released-good rate of the upstream process?
Egg Roll Production Line, Conveyor, and Factory Layout
An egg roll production line loses usable output when conveyor flow or factory layout prevents a downstream station from sustaining released-good capacity.
| Station | Measure | Hidden constraint | Limitation / not suitable for |
|---|---|---|---|
| Ingredient preparation | Batches/hour | Mixing and replenishment | Cannot support continuous filling when batches queue |
| Wrapper supply | Usable wrappers/hour | Thickness and breakage | Gross sheets hide rejected wrappers |
| Filling | In-spec deposits/hour | Recipe flow and weight tolerance | Peak cycles do not prove weight control |
| Folding and rolling | Conforming rolls/hour | Alignment, folds, seals | Nameplate cycles include malformed pieces |
| Frying or cooking | Released pieces/hour | Residence time and process limits | Do not accelerate past validated conditions |
| Inspection | Accepted pieces/hour | Sampling and reject handling | Unchecked backlog is not sellable output |
| Cooling or freezing | Released pieces/hour | Temperature and dwell time | Buffer space does not remove hold limits |
| Packing | Correct packs/hour | Film, labels, checks, changeovers | Loose pieces are not shipped units |
| Sanitation release | Available hours/shift | Cleaning, inspection, sign-off | Cannot be treated as optional downtime |
Suppose forming sustains 1,800 released pieces/hour, frying 1,500, and packing 1,300 under the same product conditions. Buying a 2,200-piece/hour forming machine won’t increase the shipped output until the packing capacity is improved.
Write a Two-Layer Capacity Acceptance Plan
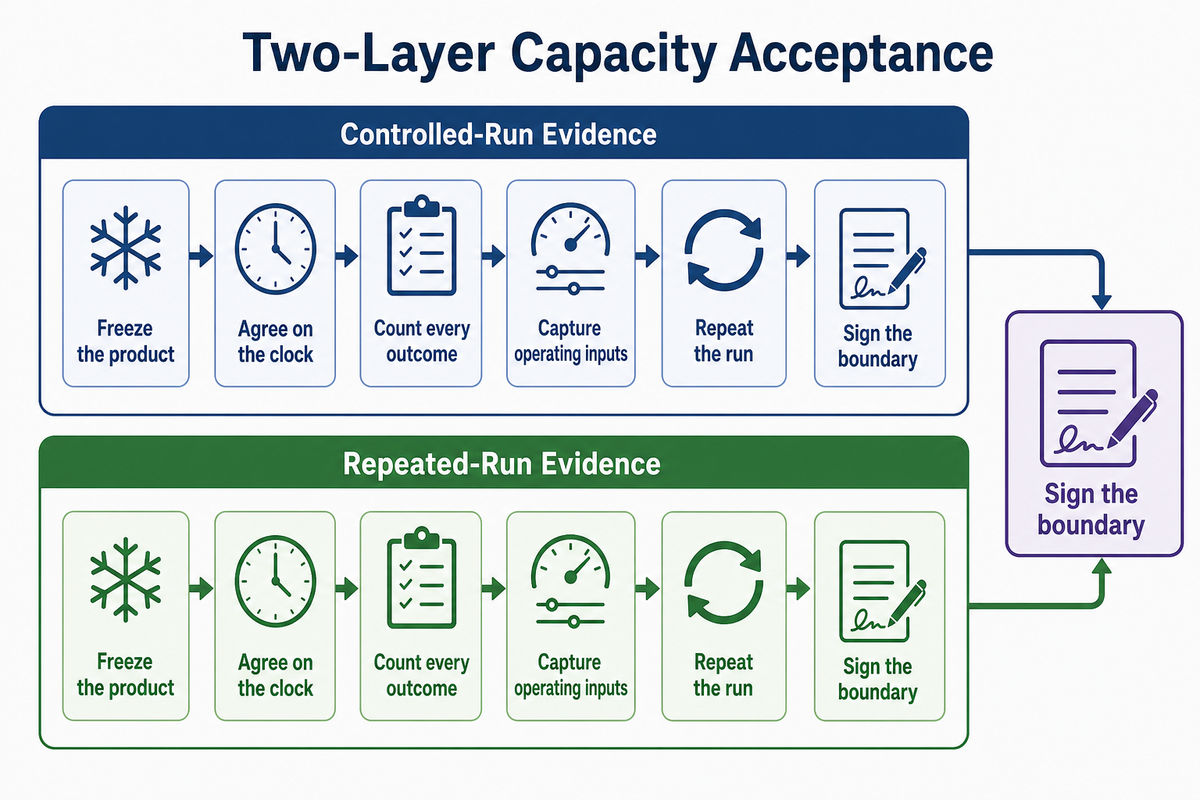
Defensible acceptance plans distinguish an observed-rate test from evidence of repeatability. Layer 1 witnesses one controlled run and records every count and stop. Layer 2 repeats the measurement over agreed products, shifts, and time windows before the buyer treats the result as sustainable capacity.
- Freeze the product: identify sheet material, filling batch, target weight, geometry, cooking method, and pack.
- Agree on the clock: define warm-up, test duration, planned stops, and start and stop timestamps.
- Count every outcome: record total pieces, commercial rejects by reason, held pieces, released good pieces, and correct packs.
- Capture operating inputs: record staffing, utilities, speed changes, alarms, micro-stops, and manual interventions.
- Repeat the run: test the agreed product mix or shifts and compare drift against buyer-approved limits.
- Sign the boundary: state what the result proves, what it does not prove, and who accepts the evidence.
Suppliers often claim that a longer study prior to shipment is unreasonable. Split the obligation: use a witnessed factory run for provisional acceptance, then place repeated-run stability criteria in site acceptance or the commercial guarantee. That ensures a reasonable buying schedule and does not present a short demonstration as a long-term high-quality result.
Normalize Supplier Offers With an RFQ Scorecard
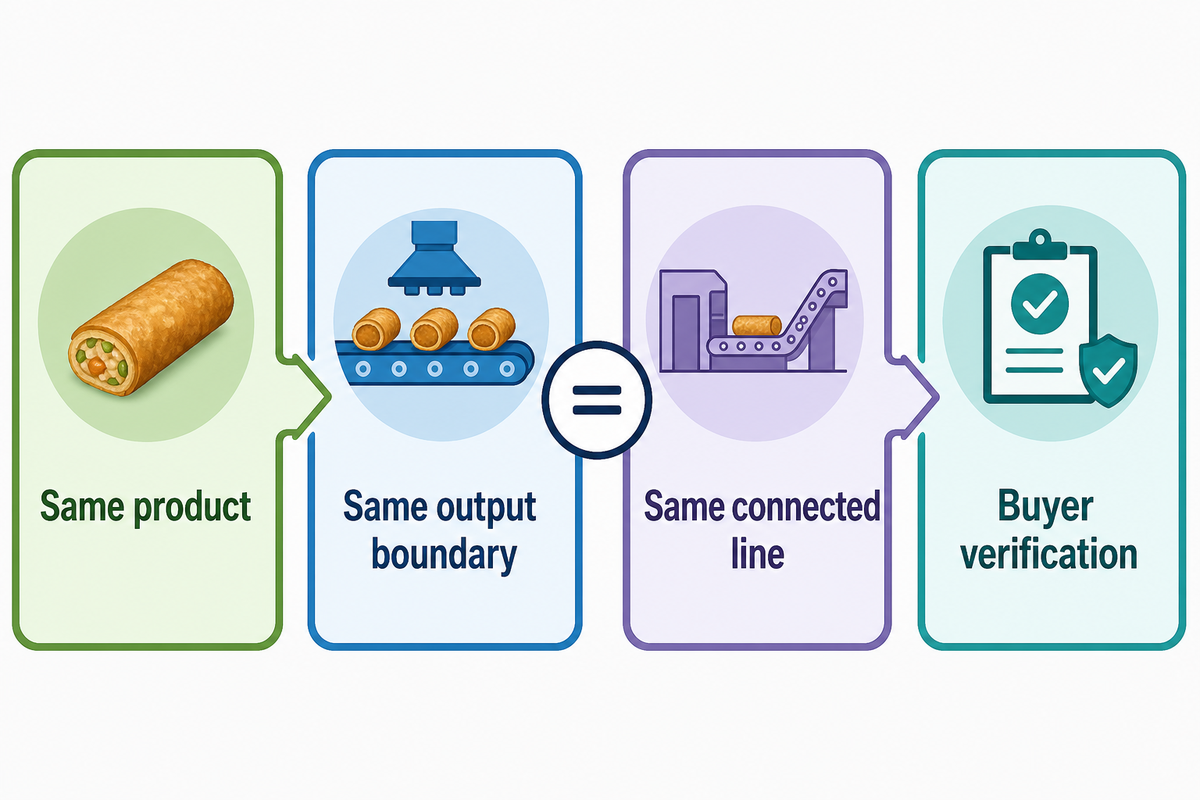
Procurement can compare offers only after all suppliers quote the same product, output boundary, connected line, scope of work, test method, utility basis, labor boundary, cleaning duty, data access, and service package. If a field is blank, it can’t be filled with an assumption.
| Field | Supplier response | Buyer verification |
|---|---|---|
| Defined product | Recipe, wrapper, filling, size, pack | Approved sample and specification |
| Output boundary | Gross, conforming, released, or packed | Signed count sheet |
| Guaranteed rate | Pieces/hour and stated conditions | Layer 1 witnessed run |
| Repeatability | Products, shifts, duration, drift limit | Layer 2 repeated runs |
| Connected scope | Preparation through packaging | Line diagram and exclusions |
| Labor | Operators and manual tasks | Observed task register |
| Utilities | Connected and measured demand | Meter or technical document |
| Cleaning and changeover | Method, time, access, release | Timed procedure |
| Controls and data | Counts, rejects, alarms, export | Live demonstration and file sample |
| Guarding and documents | Applicable market package | Buyer safety and compliance review |
| Support | Installation, training, spares, response | Named deliverables and dates |
Technical Support and Troubleshooting Scope
Technical support and troubleshooting should identify installation, training, spare-parts, response, and data-access deliverables before offers are compared.
For US workplaces, OSHA 29 CFR 1910.212 addresses point-of-operation, ingoing nip-point, and rotating-part hazards. Citing the rule doesn’t certify a machine. The buyer still needs a machine-specific risk and guarding review for the installed configuration.
“One or more methods of machine guarding shall be provided.”
Buyers working with meat or poultry fillings may also require establishment-specific sanitation controls. The USDA FSIS sanitation guide covers official US meat and poultry establishments; it isn’t a general rule for all facilities or products.
Compare Cost per 1,000 Released Good Pieces
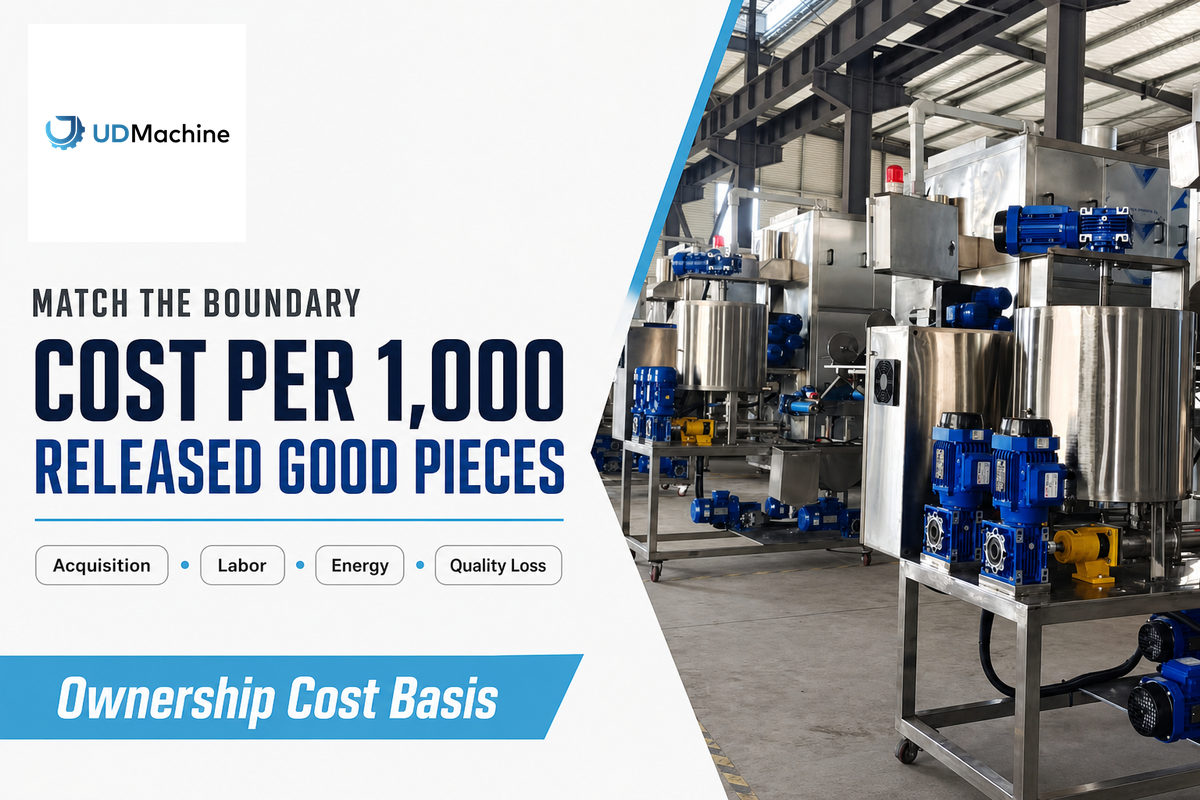
The machine with the lowest unit cost is not always the fastest quotable machine. Compare acquisition and recurring ownership costs against released good pieces under matched product and time conditions. Lower costs per unit can be achieved with faster throughput if the entire line operates at that speed and capacity, but the formula does not calculate payback.
The US Department of Energy’s life-cycle cost guidance incorporates both initial and continuing costs of ownership including energy, maintenance, repair, and disposal. The emphasis is on the federal procurement process, not on the pricing of food equipment. Alter the cost categories to fit the buyer’s requirements, and add labor, consumables, quality loss, and verified downtime.
An egg roll machine price becomes comparable when the scope and output boundaries match. A forming station quote isn’t a connected line with cooking, inspection, and packing.
Cost per 1,000 released good pieces = (allocated acquisition + labor + energy + maintenance + consumables + quality loss + relevant disposal cost) / released good pieces x 1,000.
Don’t buy extra automatic speed when a slower fryer, inspection point, or packing cell holds the line below the quoted rate. Similarly, you shouldn’t pass on a faster option if repeatedly tested capacity, release yield, and demand favor it.
Choose the Capacity Configuration
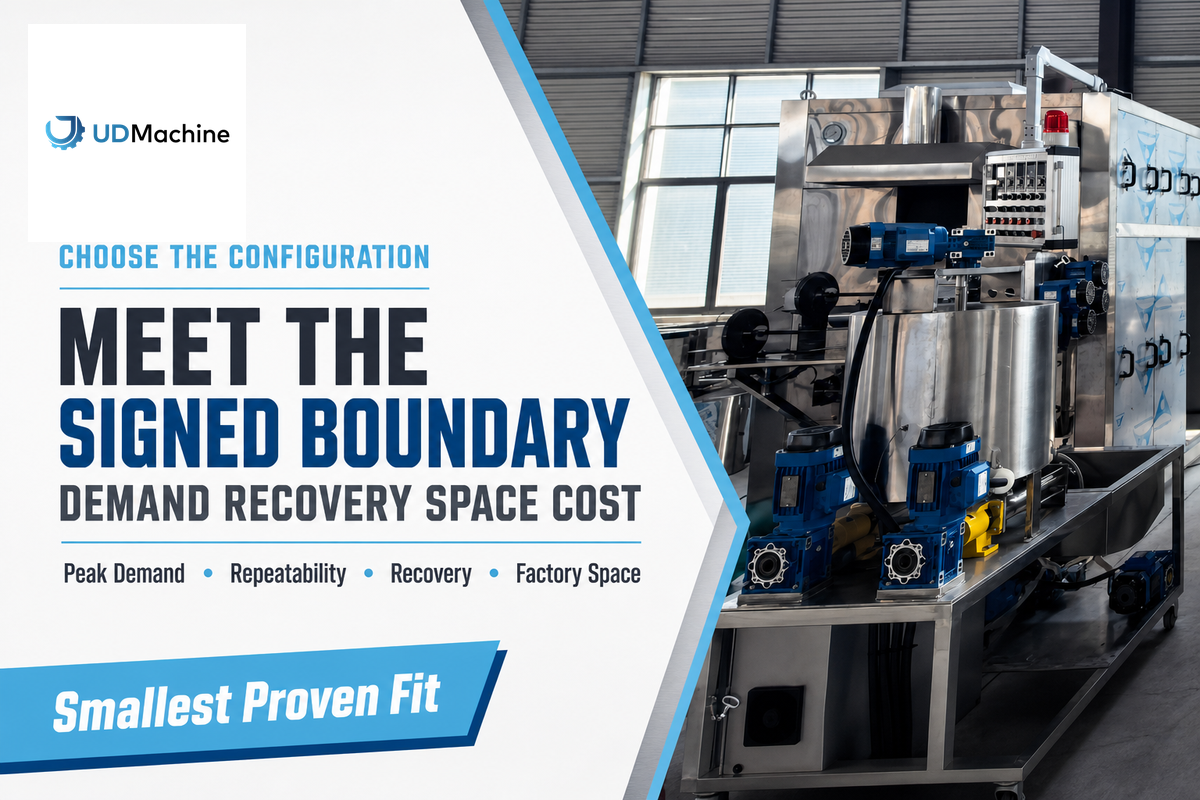
Choose one larger machine, parallel egg roll machines, or a wider turnkey solution by comparing peak demand with demonstrated released-good output, repeated-run stability, the line constraint, recovery needs, available factory space, and life-cycle cost. The best configuration is the smallest one that meets the signed operating boundary.
Parallel equipment increases redundancy and provides product flexibility, but it requires more factory space, cleaning, maintenance, and staffing. One faster line can simplify coordination, but a single failure can reduce output. The decision should follow the completed worksheet and scorecard, not a capacity tier label.
For broad equipment selection, use the commercial egg roll machine guide. Financing teams can compare the ranges of variables in the commercial egg roll machine cost guide, while contract manufacturers can review the private-label egg roll manufacturing guide.
Send a Capacity Brief, Not a Target Speed
Share your product definition, peak weekly demand, shift calendar, release criteria, planned line scope, and acceptance window. UDTECH can review those inputs before proposing an equipment configuration or test plan.
Frequently Asked Questions
How much does an egg roll making machine cost?
Answer
Price depends on the defined product, guaranteed output boundary, automation scope, cooking and packaging equipment, controls, utilities, installation, training, and service. Compare offers with the same product, released-good test, labor boundary, and connected line scope. Then model acquisition, energy, maintenance, consumables, quality loss, and planned downtime against sellable output. Purchase price alone can’t show cost per 1,000 released good pieces or establish payback.
What size is the average egg roll?
Answer
There’s no single industrial average that’s safe for machine sizing. Record wrapper width, length, and thickness; filling target and tolerance; finished length and diameter; fold geometry; and pack format. Suppliers should test the exact commercial product rather than a convenient sample because each of those variables can change handling, sealing, reject rate, and downstream residence time.
What is the name for the machine that rolls egg rolls?
Answer
Suppliers may call it an egg roll machine, egg roll making machine, forming machine, rolling station, or spring roll machine. The correct term depends on whether the equipment handles a filled savory wrapper or forms a baked wafer sheet while hot. Complete savory lines can also include ingredient preparation, wrapper handling, filling, frying, inspection, cooling, and packing equipment, so the quotation should identify the exact machine boundary.
Is it cheaper to make egg rolls at home?
Answer
Not necessarily. Commercial production economics include labor, utilities, sanitation, release yield, maintenance, packaging, downtime, and demand; household ingredient cost doesn’t answer a commercial capacity decision.
What does 2,400 pieces per hour mean in a machine quotation?
Answer
The number is incomplete until the quotation states the product, weight, recipe, run duration, output boundary, rejects, staffing, and connected equipment. One competitor page lists 2,400 pieces/hour as a maximum for 65 to 75 g products and says capacity varies by specification and recipe. Treat any quoted rate as source-specific until an agreed test reports released and packaged good pieces.
Evidence note: UDTECH supplied company background for this assignment. No unverified UDTECH throughput, staffing, investment, customer-result, or payback claim is used in the capacity model. Competitor figures are labeled, and hypothetical calculations are marked as buyer inputs.
References & Sources
- ISO 22400-1:2014 public standard page, International Organization for Standardization
- Keats Manufacturing hydraulic press measurement case, NIST Manufacturing Extension Partnership
- Assessing Process Stability, NIST/SEMATECH Engineering Statistics Handbook
- HACCP Principles and Application Guidelines, US Food and Drug Administration
- 29 CFR 1910.212, General Requirements for All Machines, Occupational Safety and Health Administration
- Sanitation Performance Standards Compliance Guide, USDA Food Safety and Inspection Service
- Life Cycle Costs for Acquisition, US Department of Energy
- Changeover improvement in a ready-meal factory, Sustainability
- Reducing Packaging Bottlenecks, Food Engineering
![Egg Roll Machine Energy Consumption [Calculation Guide]](https://udmachine.com/wp-content/uploads/2026/09/electric-egg-roll-machine-guide-featured-768x512.png)
![Egg Roll Machine Energy Consumption [Calculation Guide]](https://udmachine.com/wp-content/uploads/2026/09/electric-egg-roll-machine-guide-featured-150x150.png)