Get in touch with UDTECH Company

Egg Roll & Wafer Roll Machines: A Process Control Guide

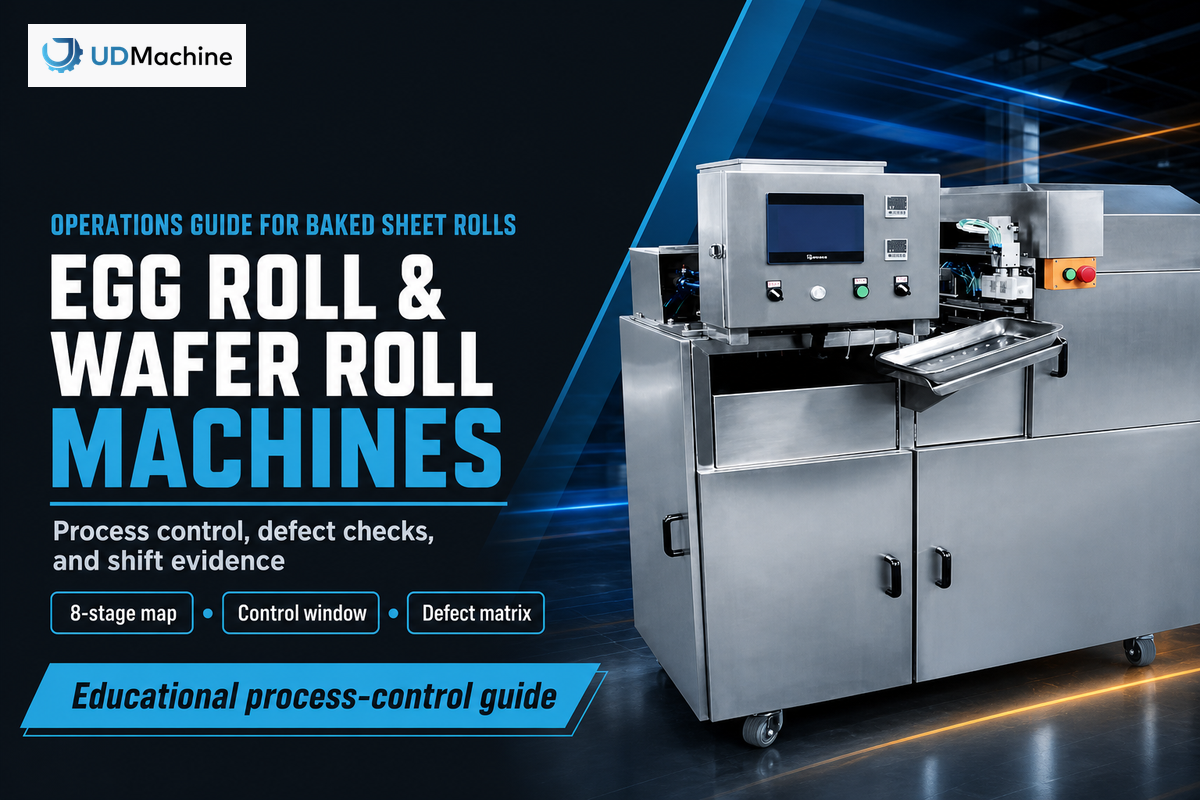
Process control field guide
How to relate batter condition, baking-plate performance, rolling time, defect, sampling, cleaning and maintenance without treating one display setting as the whole process.
Egg Roll & Wafer Roll Machines are industrial food-processing systems that turn a fluid batter into a thin baked sheet, then form that sheet while it can still bend. That brief summary conceals a coupled control problem. A crack at the cutter may begin with batter hold time. A pale band may point to deposit distribution, plate temperature distribution, contact or cycle timing. Sticking could be a surface, cleaning, formulation or release-window problem.
This document is a guide for production, quality and engineering teams who need a repeatable method to investigate those links. It covers baked thin sheets formed into hollow or filled rolls. Fried filled egg rolls, spring rolls, tabletop appliances, waffle cones as a target product and electronic wafers need other process models. It also keeps commercial machine selection distinct: model choice, specifications, options, price and quotation should go on the solution page.
“Equipment must be installed so as to facilitate the cleaning and maintenance of the equipment and of adjacent spaces.” 21 CFR 117.40(a)
Access, cleanliness and mechanical integrity may determine whether recorded settings will reproduce the observed result.
Core idea: Treat the line as a chain of observable stages. Record what enters each stage, what the machine does there and what leaves it. Change one bounded variable, then verify the result against a defined product and sampling method.
What Happens Inside Egg Roll & Wafer Roll Machines?
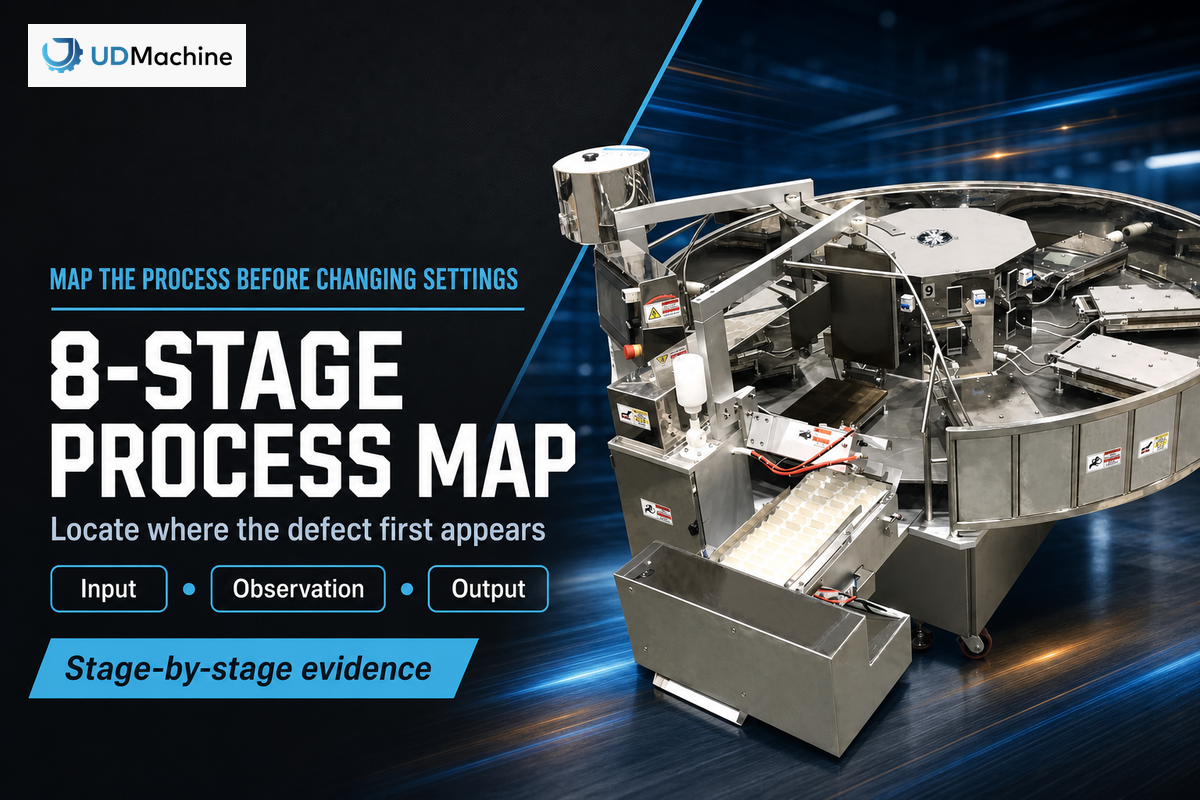
The useful process map has eight linked stages: batter preparation, depositing, plate baking, steam release, sheet release, rolling, cooling and cutting. Each stage needs an observable input and output. When a defect appears, locate its first visible stage before changing settings downstream, where the symptom may only become easier to see.
Batter carries formulation, mixing history, temperature and hold-time effects into the depositor. Each depositor distributes mass across a plate. Closing plates spread and heat the batter while water becomes steam. After baking, the sheet releases, transfers to a forming device, rolls around a mandrel or forming path, cools and is cut or handled. One non-UDTECH rolled-wafer patent illustrates the hot-strip transfer, winding and cutting sequence, but it does not prove that any particular supplier uses that mechanism.
This 8-Stage Process Map changes how a team describes faults. “The machine cracks rolls” is too broad. “The sheet leaves plate position 6 with a dry edge, survives transfer, then splits along that edge during rolling” identifies a location, chronology and discriminating observation. It also stops the cutter from being blamed for a defect that existed before forming.
- Name the first abnormal stage. Note plate position, lane, time block and product identity.
- Compare a nearby normal unit. Preserve the same measurement method.
- Check upstream records. Batter age, deposit, temperature distribution and timing may explain the difference.
- Test one bounded change. Keep the previous condition available as the comparison baseline.
Stage-map checkpoint: If the record cannot say where the deviation first appeared, the next adjustment is a guess rather than a controlled trial.
Build a Batter-to-Roll Control Window
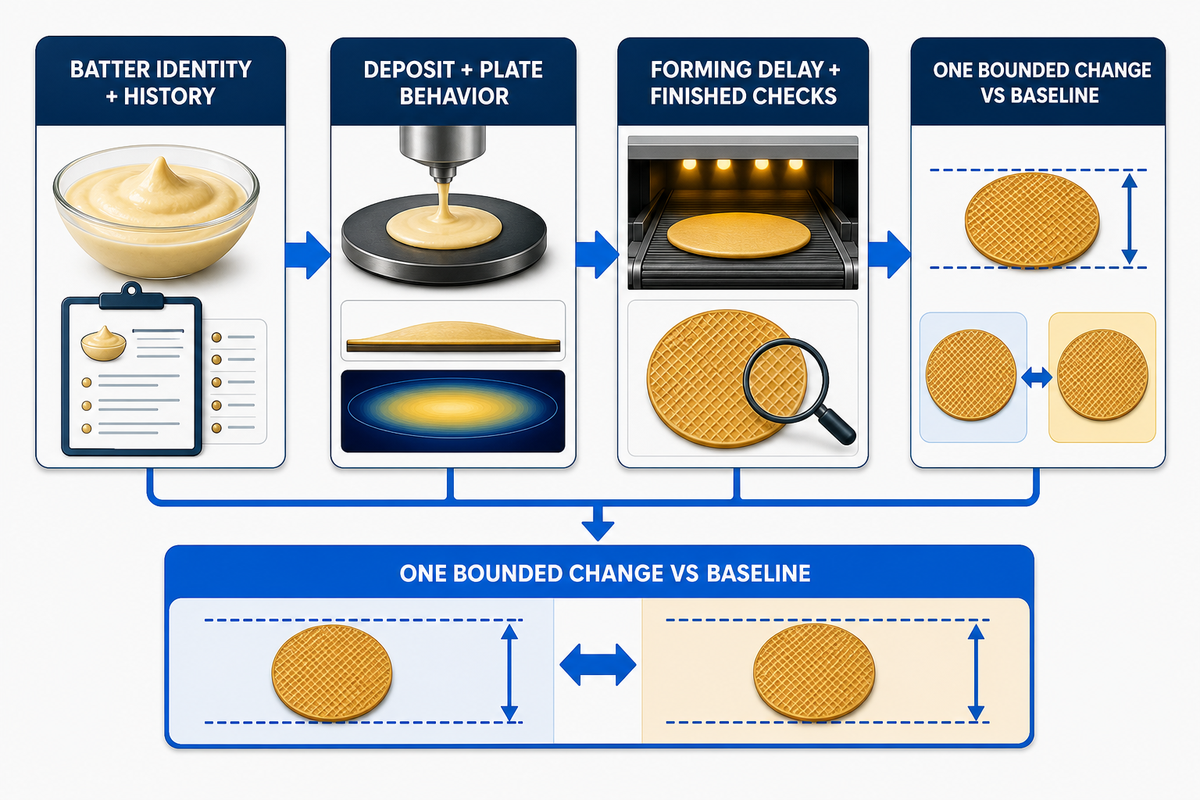
A control window links conditions instead of listing isolated targets. Record batter identity, preparation history, temperature, hold time and deposit condition beside plate behavior, release, forming delay and finished-roll checks. Establish the acceptable combination for one named product through trials, using the prior bounded-change baseline; do not transfer a recipe or timing window from another formulation without verification.
Start with the variables the line can actually observe. Useful batter records may include ingredient or recipe code, lot identifiers where relevant, mix start and finish times, mix method, measured temperature, the plant’s chosen flow or viscosity test, hold duration and recirculation state. Deposit records should use the plant’s verified method, such as mass per sheet or another repeatable measure, rather than an uncalibrated dial position.
Peer-reviewed industrial wafer-oven research demonstrates why linked records matter. Its measured plate-temperature distribution, sheet thickness and color behavior changed with operating conditions. Reported numerical spreads belong to that apparatus and test envelope; they are evidence that distribution and rate matter, not ready-made settings for another line.
Build the window in small trials. Hold the product and measurement method constant. Record the baseline, make one planned change, wait for the defined process delay, then sample the corresponding product. If batter residence time is longer than the observation period, include that lag. Otherwise, product attributed to a new setting may still reflect the old batter condition.
Do: define the product, method, time and acceptance check for each trial. Do not: change batter dilution, deposit, plate temperature and line rate together, then credit the variable that happened to move last.
Once the acceptable combinations are known, store the window as a versioned production reference. Settings without the associated product, method and date are not a baseline. A “good run” without actual observations is only a memory.
Control-window checkpoint: A trial is reusable only when another qualified operator can identify the product, reproduce the measurement and distinguish the tested change from material and timing effects.
Control Baking Plate Temperature, Deposit and Release

A plate-temperature display is only one piece of evidence. Judge baking by temperature distribution, deposit distribution, cycle timing, steam release, plate contact, surface condition and the resulting sheet against the product-window baseline. Compare positions and time blocks. A stable setpoint can coexist with uneven heating, wear, contamination or product loading that changes color, thickness and release.
Map the plate system spatially. If the equipment has repeated plate positions, assign stable identifiers. Compare center and edge behavior where the measurement method permits. Track which position produced each sample. This is not about collecting a large spreadsheet; the purpose is to separate a line-wide change from a repeating position-specific pattern.
That industrial study cited above reported roughly 13°C versus 7°C temperature spread and about 0.38 mm versus 0.16 mm thickness spread under two tested production-rate conditions. Those figures are apparatus-bound examples, not tolerances for UDTECH equipment or for the reader’s product. Their value is diagnostic: rate, thermal distribution and thickness can move together, so one average temperature may hide the pattern.
Release must also be observed, not assumed. Define what normal separation looks and sounds like, then record residue location, edge lift, tears or repeated sticking positions. Before changing temperature, check deposit consistency, batter history, plate cleanliness, surface condition, closure and timing. For machine families, configurations and commercial details, the solution page explains what the baking plate actually decides.
- Line-wide pale product: confirm measurement method, batter and cycle state before increasing heat.
- One repeating dark position: compare that plate’s distribution, deposit and contact with neighboring positions.
- Random sticking: look for batter-age, contamination, deposit or timing variation rather than treating every event as surface wear.
- Gradual release deterioration: pair cleaning and condition records with product observations.
Release decision: Change heat only after the evidence separates a thermal pattern from deposit, batter, timing, cleanliness and mechanical-contact alternatives.
Time Rolling, Cooling and Cutting Before the Sheet Turns Brittle
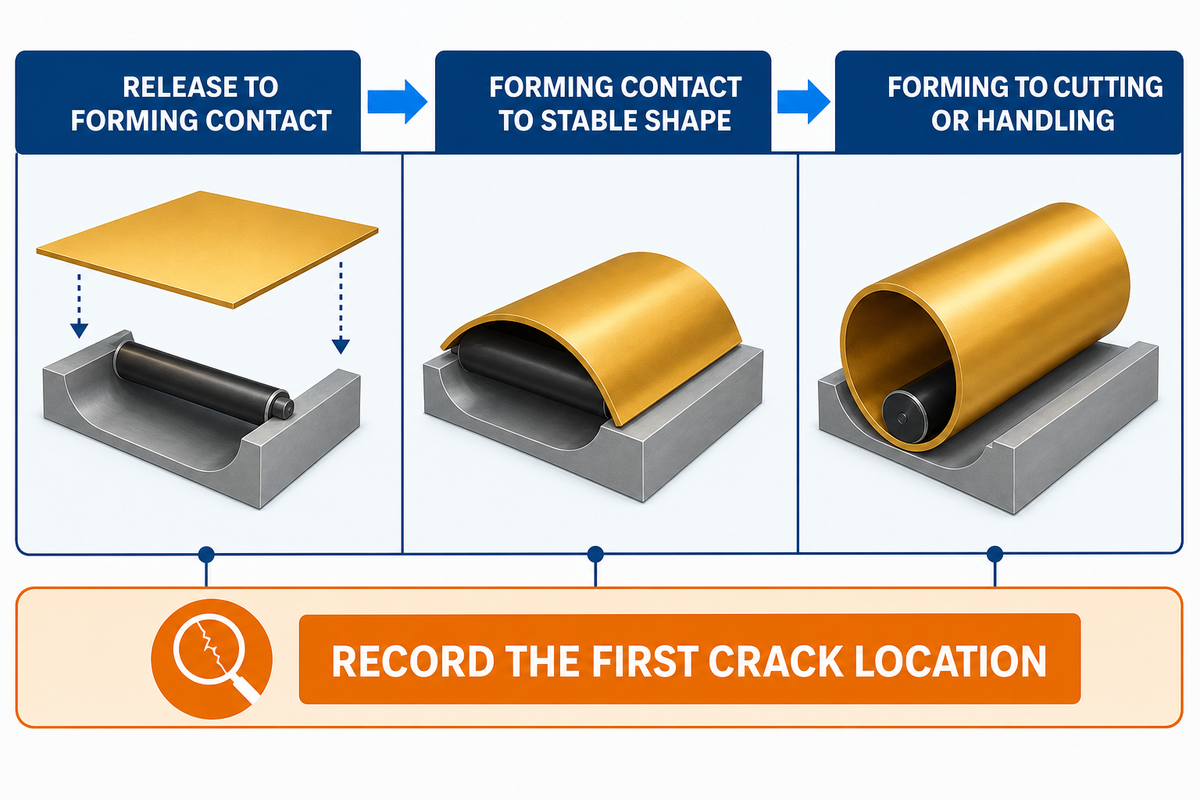
The forming window begins when the sheet leaves the baking surface. Transfer should be prompt and consistent, building on those release observations, but there is no universal delay or forming temperature. Usable windows depend on formulation, moisture, sheet geometry, temperature and ambient exposure. Measure transfer behavior for the named product instead of copying another line’s speed.
Related open-access rolled-cone formulation research describes forming immediately after baking and shows that formulation affects the finished structure. It is useful qualitative evidence, not proof of a timing or moisture limit for wafer rolls. That earlier patent mechanism likewise supports hot-sheet winding, while its geometry and claims remain the patent owner’s.
Separate three intervals in the record: release to forming contact, forming contact to stable shape and forming to cutting or downstream handling. If the control system exposes timestamps, verify that they correspond to physical events. If not, use a repeatable observational method that does not put staff inside a hazard zone. Record ambient conditions only when there is a reason to test their influence.
For cracks, note whether they start before contact, at initial wrap, along a seam, during cutting or after cooling. A crack at initial wrap suggests a different investigation from breakage after packing. For diameter variation, compare incoming sheet geometry and forming position before changing forming pressure or speed.
Forming-window checkpoint: Record the first crack location and the relevant event interval. “Brittle” is an outcome; the time-ordered path to that outcome is the diagnostic evidence.
Use a Defect-to-Variable Matrix for Cracks, Sticking and Uneven Color
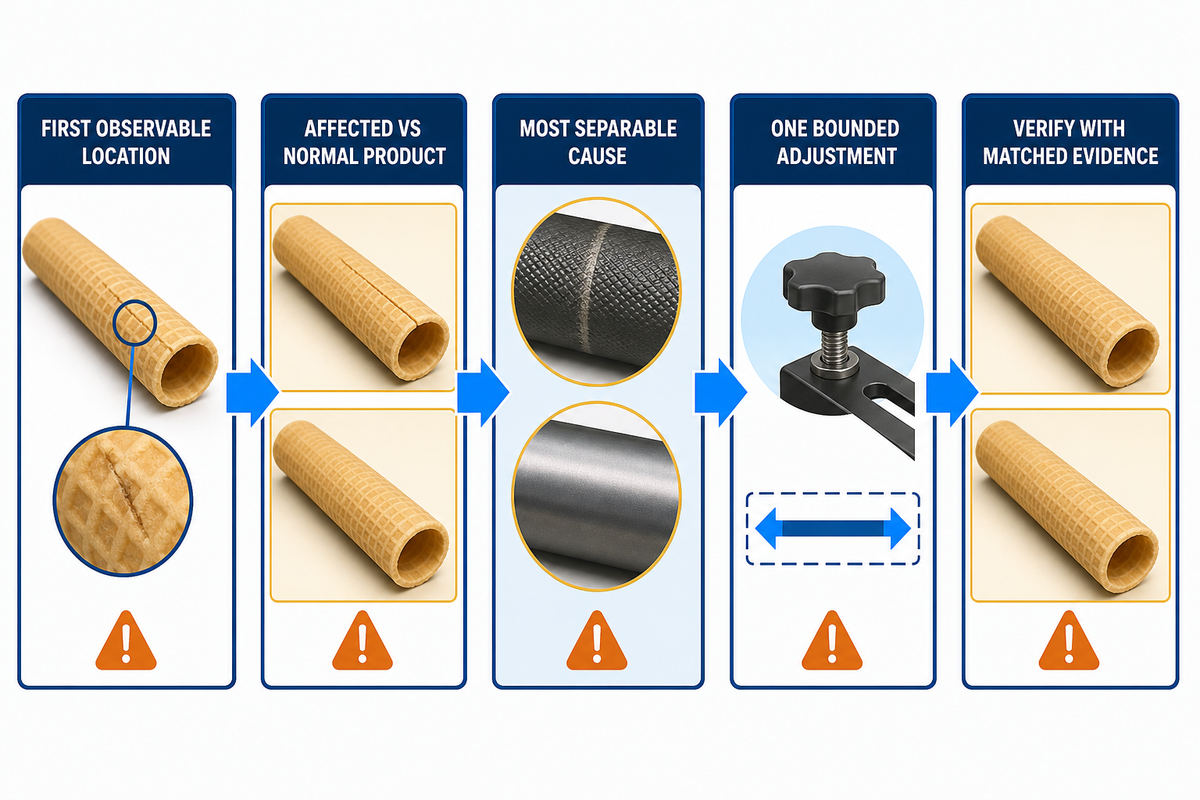
A defect matrix converts symptoms into discriminating checks. Begin with the first observable location, compare affected and normal product, test the most separable cause, make one bounded adjustment and verify, using those crack and forming locations as matrix inputs. The matrix below is a diagnostic route, not a universal corrective-action table. Plant limits and safe procedures remain product- and site-specific.
| Observed symptom | First discriminating check | Bounded trial | Verification | Limitations |
|---|---|---|---|---|
| Pale product across the line | Confirm color method, batter identity, production rate and temperature distribution | Change one validated thermal or timing variable | Compare time-linked samples after the process delay | Color is formulation- and method-dependent |
| One repeating dark band | Map plate position, deposit and local temperature | Correct the confirmed position-specific condition | Sample the same and adjacent positions | Surface emissivity can affect thermal readings |
| Sheet sticks at random | Compare batter hold time, deposit, residue and release timing | Change one confirmed upstream factor | Track sticking events per defined sample unit | Do not infer plate wear from randomness alone |
| Sheet sticks at one position | Inspect repeatability, cleanliness, contact and surface condition | Clean, inspect or service under the plant procedure | Compare before and after at the same position | Inspection does not replace hazardous-energy control |
| Crack begins before rolling | Check sheet edges, thickness pattern and transfer path | Correct the verified sheet or handling cause | Observe first-crack location on matched samples | No generic moisture target applies |
| Crack begins at initial wrap | Compare transfer interval, sheet temperature proxy and alignment | Adjust one verified timing or alignment factor | Count first-wrap cracks under the same product | Related cone data cannot set wafer-roll limits |
| Diameter drifts gradually | Trend incoming sheet geometry, forming condition and time | Address the variable that changes before diameter | Use a defined geometry method and sequence | Time order alone does not prove causation |
| Cut end fractures | Separate pre-existing cracks from cutting contact and tool condition | Service or adjust only the confirmed cause | Inspect ends and upstream sheet on matched units | Tool service must follow the site procedure |
| Breakage rises after cooling | Compare handling, cooling exposure, geometry and upstream cracks | Change one handling or verified process factor | Report breakage at a defined downstream point | Ambient effects require a controlled comparison |
| Defect follows a changeover | Compare recipe version, cleaning verification and restart baseline | Restore one verified baseline condition | Use first-off samples and documented disposition | Visual cleanliness alone may be insufficient |
This is the Defect-to-Variable Diagnostic Matrix. It applies the traceable-monitoring principle described in the NIST process-monitoring handbook. Add plant-specific acceptance criteria only after the measurement system, product and safe work method are defined. Where two causes remain plausible, design a check that separates them before moving a setting.
Verify Quality With a Time-Ordered Sampling Plan
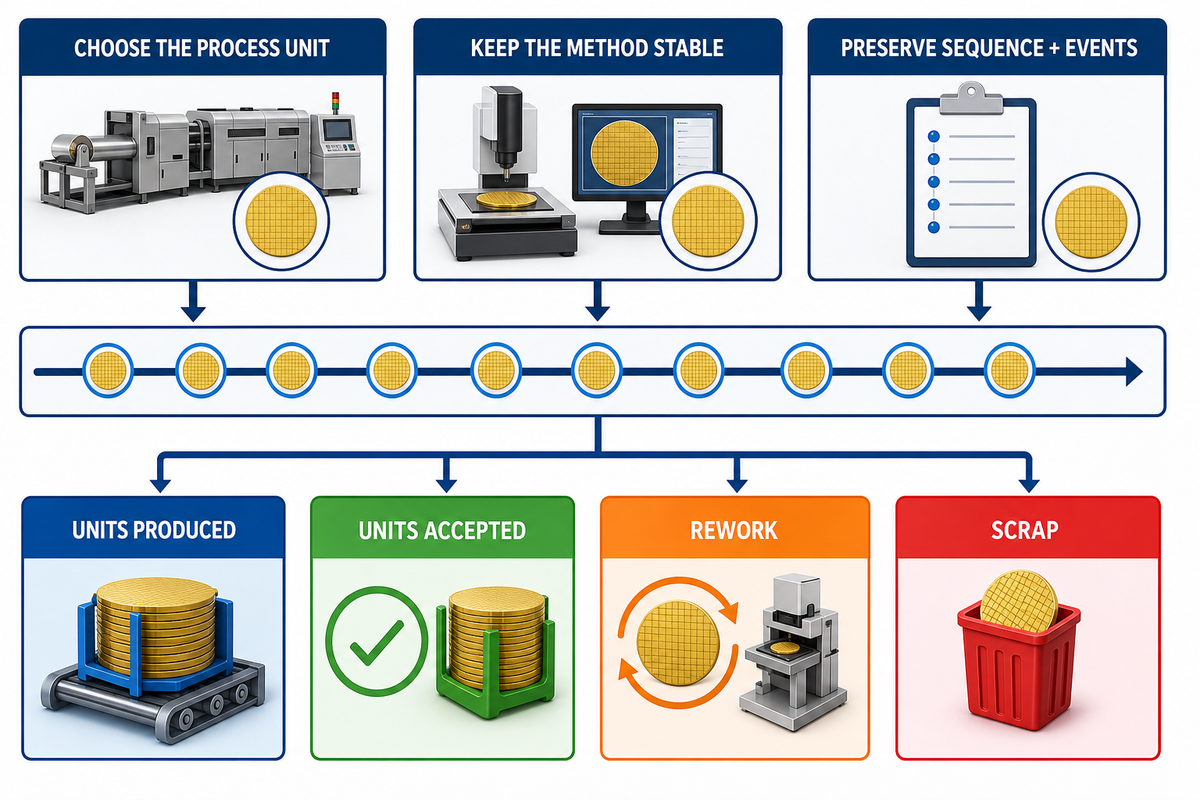
Choose the sampling unit from the process model, not from habit. A run, batch, time block, plate position, lane or shift may be appropriate. Preserve product identity, method, sequence and process events. Time order supports traceability, but it does not by itself prove statistical independence, capability or control.
One NIST sampling example chooses a run as the primary sampling unit after examining the process model; it does not declare “shift” correct for every factory. Likewise, NIST’s work on autocorrelated process data warns that the independence assumption is often invalid. Chronological points can be related to earlier points.
Define what each result means. Nominal machine speed is not saleable output. Useful reports separate units produced, units sampled, accepted units, rework where applicable and scrap at a named observation point. If breakage occurs after the machine, decide whether the sampling plan follows the product far enough downstream to answer the business question.
Keep methods stable. Sheet mass, thickness, diameter, length, color, moisture proxy, breakage and appearance all require a stated device or method. Record calibration or verification status where relevant. When the method changes, do not place old and new values on one trend as though they are directly comparable without an evaluation.
Sampling decision: State the process unit, measurement method, sample timing and disposition rule. Neat charts cannot repair an ambiguous sample definition.
Clean and Change Over Without Losing the Baseline
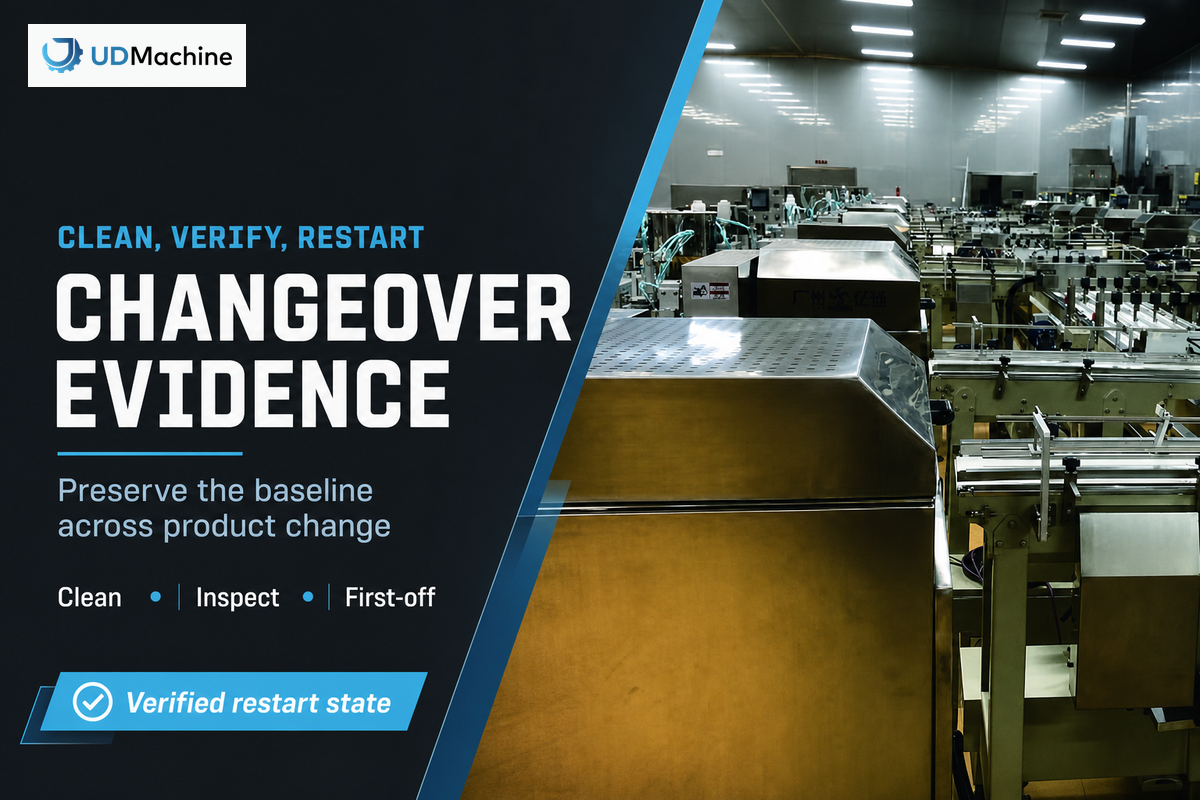
A sound changeover removes the prior product while preserving a verified restart state. The plan should cover product and allergen boundaries, accessible food-contact areas, removed parts, cleaning method, inspection or verification, reassembly, guarding, hazardous-energy duties and first-off disposition. A generic guide can’t replace the site’s hazard analysis or procedures.
Food-safety and machine-safety duties should not be blended into one vague checklist. 21 CFR 117.40 addresses cleanable equipment and protection against allergen cross-contact. For United States workplaces, OSHA 1910.147 defines the scope and exceptions for control of hazardous energy during servicing, while OSHA 1910.212 addresses guarding against machine hazards in normal operation.
Powder handling requires another boundary. OSHA identifies sugar, starch and flour among materials that can be combustible dusts, but that list doesn’t determine the hazard of a specific facility. The site must assess its materials, quantities, collection, ignition sources and applicable requirements. Don’t turn a broad caution into a claim that every line has the same dust classification.
After reassembly, verify the baseline before releasing a long run. Confirm the correct recipe version, parts, guards, plate state, deposit check, timing, first-off appearance and required quality measures. Record exceptions and who made the disposition. “Cleaned” and “started” are events; the evidence pack must show the acceptable restart condition.
Changeover boundary: Cleaning verification, allergen control, guarding and hazardous-energy control are related but distinct duties. Each needs the plant’s applicable method and accountable record.
Pair Scheduled Maintenance With a Condition Record
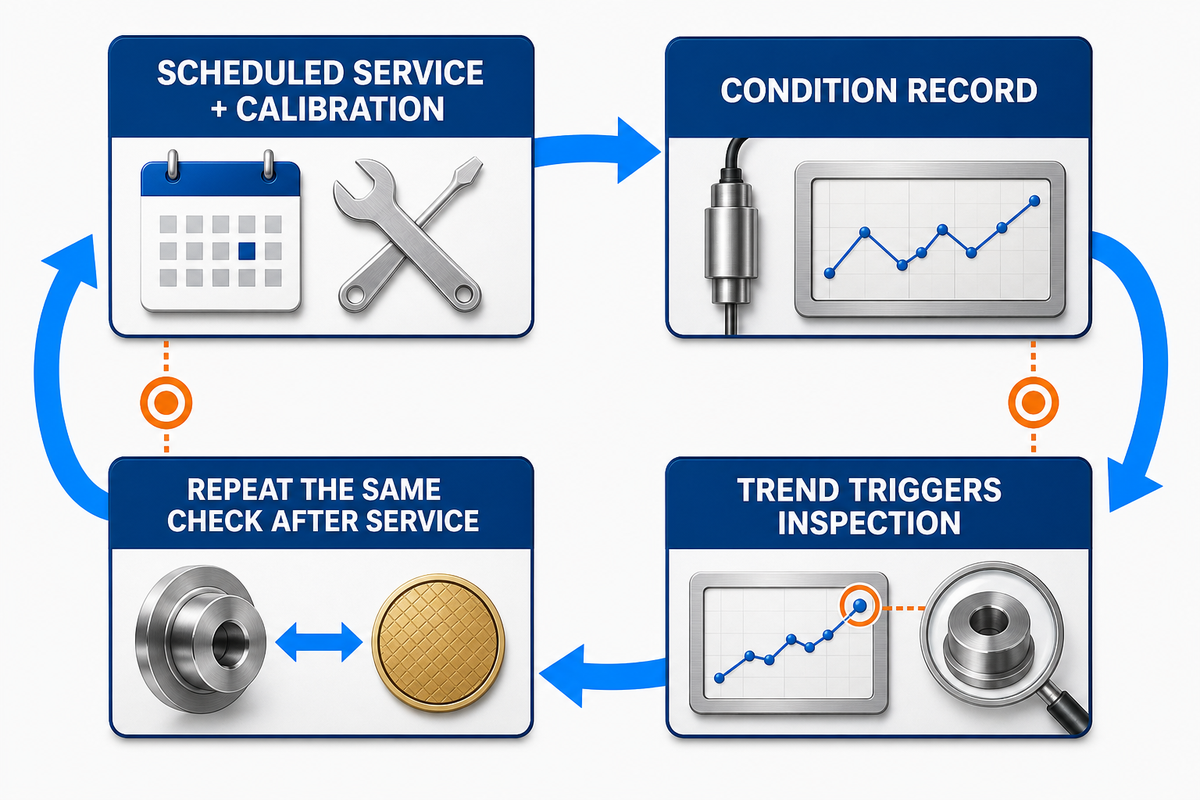
Scheduled preventive maintenance and condition records belong together. Calendar or run-hour tasks protect known service needs; observations of plate condition, release behavior, temperature distribution, timing, noise, alignment and recurring defects help prioritize investigations. Condition monitoring doesn’t cancel scheduled work, and a calendar alone can’t explain a developing process pattern.
21 CFR 117.305 sets general content requirements for records under its scope, including actual values and observations obtained during monitoring and, as appropriate, verification activities. That recordkeeping framework does not prescribe a maintenance interval for this line. Build scheduled maintenance and calibration into the site’s documented program because duty, design, materials, operating hours, environment and supplier instructions differ.
Make condition entries comparable. “Plate looks bad” is weak. A stronger record names the plate position, observation method, residue or damage location, date, related release behavior, product and action. When a recurring dark band, sticking position or timing drift appears before service, link the maintenance record to the product evidence. After service, repeat the same check.
Use trends to trigger an inspection, not to declare a cause prematurely. Gradual diameter drift may track forming wear, incoming sheet geometry or another variable. The condition record earns its value when it narrows the next safe inspection and documents whether the intervention restored the baseline.
Commission the Process With a Shift Evidence Pack
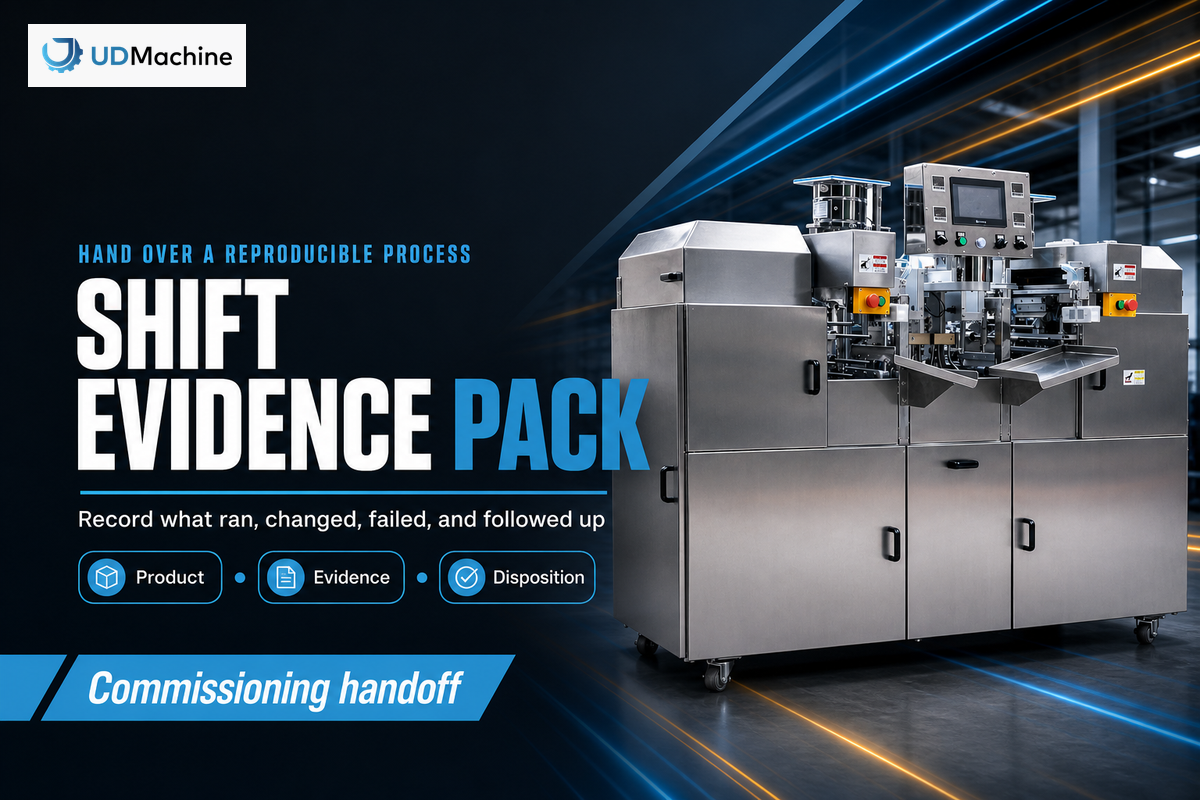
Commissioning should hand over a reproducible process, not a folder of final settings. The Shift Evidence Pack joins product identity, approved recipe version, actual observations, times, performer, measurement methods, exceptions, dispositions and change history, carrying the condition record into commissioning evidence. “Shift” is the handoff rhythm here, not a claim that every sampling unit must be a shift.
Current 21 CFR 117.305 requires records under its scope to contain actual values and observations, dates and times where appropriate, the activity performer’s identification and product or lot identity where appropriate. Those fields are a useful granularity check. Using them does not make this article, the pack or the equipment a compliance certificate.
Build the Shift Evidence Pack around questions the next team must answer:
- Which named product and recipe version ran?
- Which material lots or batter batches matter to traceability?
- What baseline conditions and actual observations were recorded?
- Which plate, lane, time block or other unit produced each sample?
- What measurement methods and devices were used?
- What changed, who approved the bounded trial and what product delay applied?
- What failed, what was held and how was the disposition recorded?
- What condition or maintenance observation needs follow-up?
Close commissioning only when the receiving team can reproduce the approved product window, identify an out-of-window result and follow the escalation route. A factory acceptance event, site startup and routine production may need different evidence. Keep those stages distinct instead of treating one successful demonstration as permanent proof.
Handoff test: If the next shift cannot tell what ran, what was measured, what changed and how exceptions were handled, the process has settings but not a defensible baseline.
Frequently Asked Questions
What is the first setting to change when wafer rolls crack?
Do not select a setting until you find where the first fissure appears in the stage map. Check whether the sheet is already torn at release, tears during transfer, tears at initial wrap, splits during cutting or breaks after cooling, and note its first location. Compare batter history, deposit and sheet profile before modifying a bounded thermal, timing, handling or alignment variable while holding the other recorded conditions steady. Then sample after the relevant process delay and document the result.
Can one plate-temperature target work for every wafer roll product?
No. A displayed target does not describe temperature distribution, plate contact, deposit, cycle timing, surface state, formulation or desired color and texture. Establish a product-specific control window with a defined measurement method. Published experimental values can reveal mechanisms, but they should not be copied as a machine target unless the product, apparatus and test envelope are demonstrably equivalent.
How should saleable output be checked?
Define the observation point and period. Separate total units from conforming units, rework and scrap, then link the result to the product, recipe, process state and sampling method. Nominal speed excludes downstream breakage and rejection; statistical claims require an appropriate process model.
Does condition monitoring replace preventive maintenance?
No. Scheduled work covers known service and calibration needs; condition records show developing patterns. Use both. After maintenance, repeat the same product and measurement check to verify that the process baseline returned instead of assuming a completed calendar task restored performance.
What belongs in a wafer-roll changeover record?
Include prior and next product identity, recipe version, material or allergen boundaries, parts removed, cleaning method, inspection or verification, reassembly, guarding and applicable hazardous-energy steps, baseline checks, first-off measurements, exceptions and disposition. The exact record must follow the site’s hazard analysis, procedures and legal duties; a generic checklist is not a substitute.
References & Sources
- Crossref DOI record: Applied Sciences industrial wafer-baking temperature, thickness and color study
- US6254916B1: non-UDTECH rolled-wafer winding and cutting mechanism
- Open-access related study on formulation and forming of rolled cones
- NIST/SEMATECH: worked sampling-plan example
- NIST: statistical monitoring of autocorrelated process data
- Electronic Code of Federal Regulations: 21 CFR 117.40
- Electronic Code of Federal Regulations: 21 CFR 117.305
- OSHA 1910.147: control of hazardous energy and OSHA 1910.212: machine guarding
- OSHA: combustible-dust overview
- 21 CFR 117.40: equipment, cleaning and allergen cross-contact
Technical note: External numerical examples in this guide remain limited to their cited apparatus and test conditions. They aren’t UDTECH specifications, guarantees, regulatory approvals or universal operating limits.