Get in touch with UDTECH Company

Uneven Crepe Dentelle Baking: Find the Cause Before Changing Heat

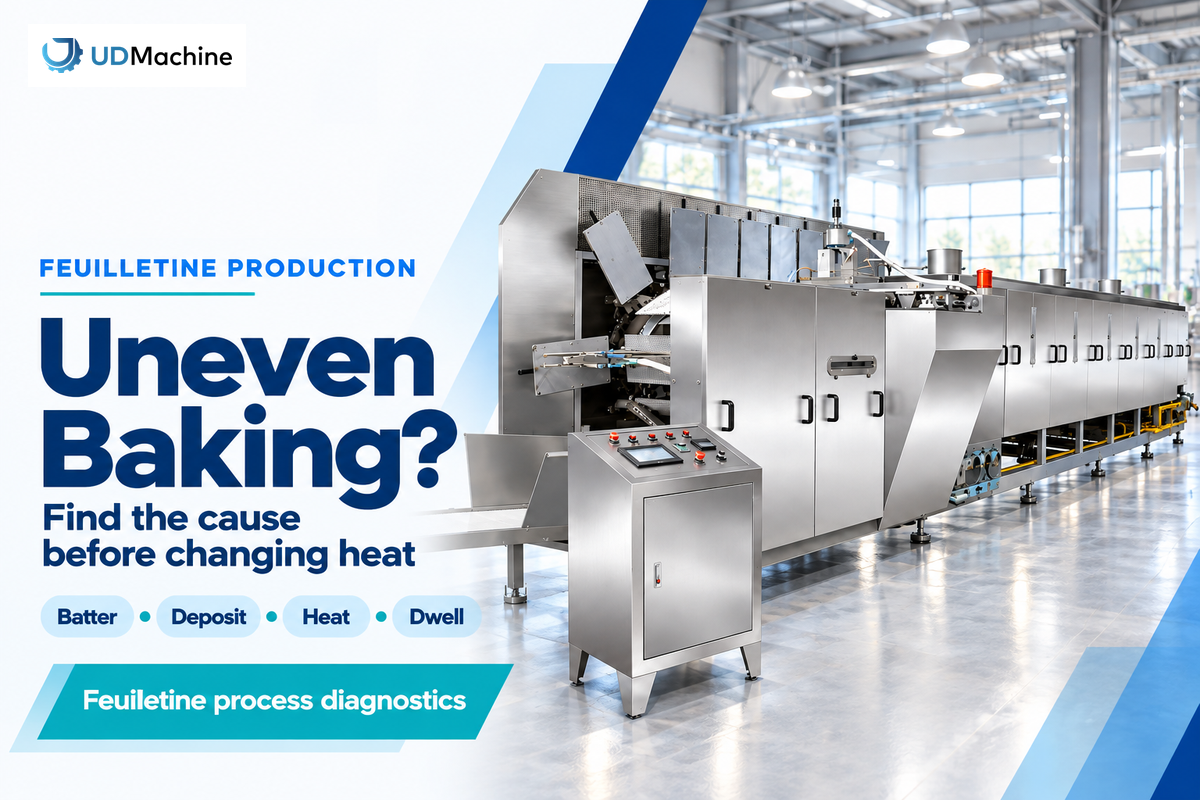
Six checks must be made for uneven crepe dentelle baking: location of defect, condition of batter, consistency of deposit, surface heat, dwell time, and exposure time to cooling. First identify the pattern and then change a single factor. Colors by themselves can’t distinguish a thin deposit from an excess heat condition.
A dark edge beside a pale centre can send a production team straight to the oven controls. Prior to making that adjustment, they must determine if the defect is associated with position, plate, or batch time. Those observations indicate which measurement is pertinent. This manual is for thin layers of crêpes dentelles, the crispy crepes used in feuilletine, rather than a cookie recipe. The checks are for a trial discussion on a feuilletine production line.
Uneven crepe dentelle baking: map the defect before changing settings
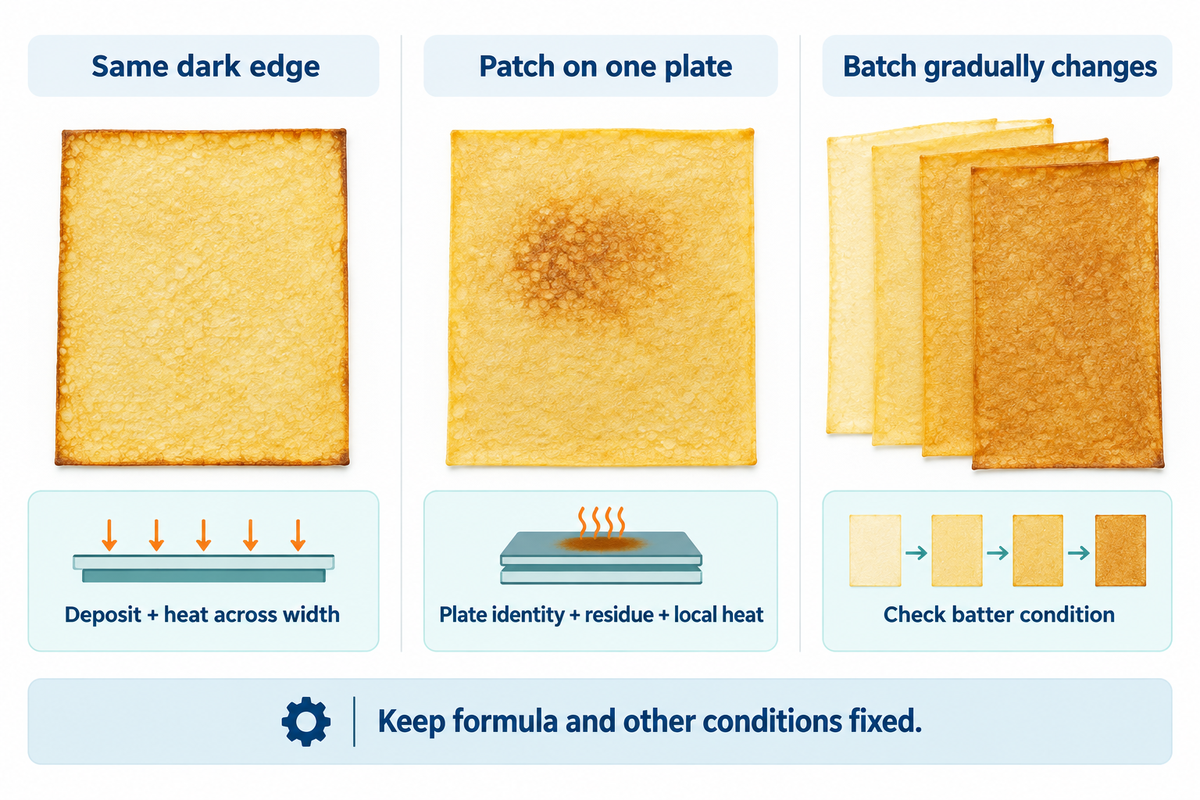
When a defect appears for the first time is often as important as where it occurs. A fixed stripe suggests a different first check from a whole sheet that gradually darkens. Photograph samples under consistent lighting, label their orientation, and use an accepted reference from the same product specification as a comparator.
The 6-Check Bake Fault Map below is a guide to potential problems associated with uneven crepe dentelle baking. The six checks are: location, batter, deposit, heat, dwell, and exposure. Several patterns may point to the same check. Each row provides a testable lead and not a definitive answer. Keep the formula, other factors and conditions fixed while investigating the lead.
| Observed pattern | First check | Useful comparison | Decision boundary |
|---|---|---|---|
| Same edge darker on successive sheets | Deposit and heat across width | Edge and centre thickness with corresponding surface readings | Do not raise whole-machine heat to correct one pale band |
| Dark patch returns with one plate | Plate identity, residue and local heat | Suspect plate versus another at the same cycle stage | Inspect only through approved access procedures |
| Colour alternates in a repeating sequence | Cycle and deposit timing | Cycle labels against feed and control records | An average temperature can hide the sequence |
| Whole sheet changes as a batch ages | Batter condition | Temperature, holding time and repeatable flow measurement | Do not compare batches with different formulas |
| Pale area overlaps a thick deposit | Deposit distribution | Wet deposit mass and finished thickness by position | Correct the feed cause before increasing exposure |
| Streak follows a visible surface mark | Residue or surface condition | Pattern before and after approved cleaning | A persistent line is not proof of poor plate material |
| Broad colour change follows a speed adjustment | Dwell time and feed coordination | Actual residence time, deposit mass and saleable output | Speed can change more than baking time |
| Sheet leaves the bake crisp but later softens | Cooling and exposure | Equally cooled samples with different handling histories | Extra oven heat may not address moisture pickup |
| Crunch improves but fines increase | Crispness and breakage together | Accepted flake fraction under the same crushing conditions | A drier sheet is not automatically a better product |
We find a good example in a 2025 industrial wafer-plate study. Researchers studied five selected plate sets of each of two materials, at 23 and 31 pieces/min. Thermal and color results were affected by the material and speed, but the material didn’t significantly affect the shape of the dark lines. Two authors worked for equipment manufacturer NEFAMAK; the experiment was concerned with that study of a wafer system. The main point is to verify the observed pattern before suggesting a change in material.
For the surrounding production stages, refer to how feuilletine is made industrially. The checks here focus on finding the bake fault instead of repeating the entire process of the line.
Batter viscosity and deposit checks: establish a repeatable baseline
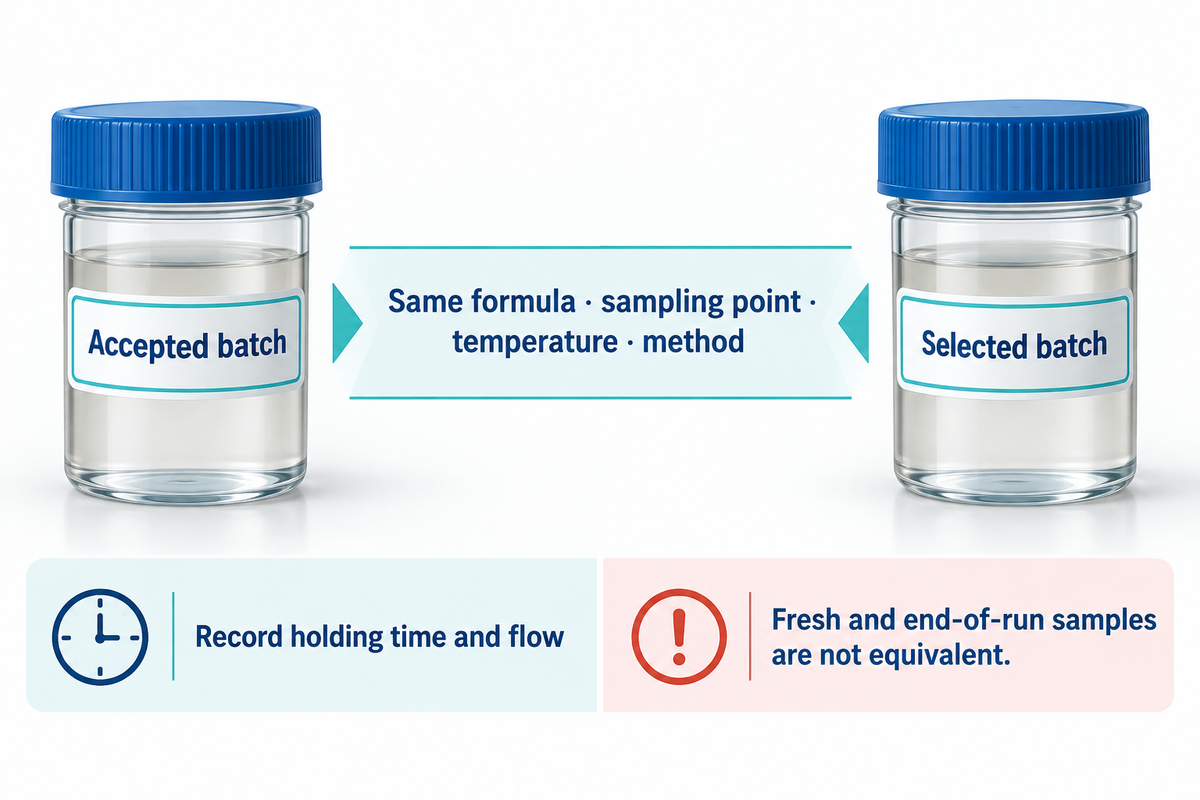
Compare a selected batch to an accepted batch using the same formula, sampling point, temperature and test method, and note the results. Holding time, as well as the viscosity or flow, should be recorded. A result taken immediately after mixing can’t reasonably be compared with a result taken at the end of a long run.
What consistency should my crepe batter be?
It’s to be expected that the production of crepe batter will result in reproducible spreading through the actual depositing system and forming a thin, even layer. The useful target is the measured range of accepted production using the same formula. A deposit described as “like cream” or any other similar subjective description can’t establish a viscosity specification or prove that the deposit is uniform.
In Dogan’s wafer-batter study, holding time strongly influenced viscosity. Maintain a batch record for flour lot, water addition, mixing sequence and time, and the time at which the batch was deposited. Be sure to record additions of egg white, butter or other fats, as well as sugar and salt as they appear in the approved formula. An operator’s last-minute adjustment changes the comparison even when the batter looks similar to what was approved.
A separate study of fresh egg waffles measured density to monitor aeration alongside viscosity and found ingredient-dependent baking behaviour. Since they were soft waffles, their formulation targets don’t apply to a crisp-sheet line. This suggests that matching viscosity alone isn’t sufficient; other factors such as recipe identity and air incorporation should be taken into consideration. The laboratory whisk trial and the production mixer should have separate records.
How to tell if crepe batter is too thin?
If the measured flow and deposited layer fall outside the accepted baseline for the formula, confirm the test at the same sample age and temperature. Excessive spreading or a lighter deposit is a reason to conduct further investigation. This isn’t evidence to automatically add flour to the formula.
Check the feeder setting and delivered mass before correcting the recipe. A pump or gap change or a distribution change can change the sheet without a change in viscosity. Compare equal deposit areas, and keep wet deposit measurements separate from baked sheet weights; moisture loss prevents a direct one to one comparison. If a formula correction is needed, test it as a separate change and document.
Use the following form to link observations in width, cycle and batch age. For first diagnostic comparisons, take nine samples in three consecutive cycles and three sample positions. This sampling layout is just an example, not a statistically validated acceptance plan; expand the layout if the observed cycle is longer.
| Record | Unit or label | Keep comparable |
|---|---|---|
| Formula and ingredient lots | Revision and lot IDs | Same approved recipe |
| Batter age at sampling | min since mixing ended | Defined start event |
| Batter temperature | °C | Same location and method |
| Viscosity or flow | mPa·s or method-specific flow time in s | Instrument, settings and sample temperature |
| Deposit mass | g per defined area or deposit | Same collection boundary |
| Width location | Left, centre, right | Same orientation and offsets in mm |
| Plate and cycle | Plate ID and cycle number | Same stage of operation |
| Surface temperature | °C | Instrument, emissivity and viewing geometry |
| Actual exposure | s through the defined heated section | Same start and end points |
| Sheet and cooled product | Thickness in mm; conditioning time in min | Same measuring pressure and cooling history |
Baking temperature uniformity: check the surface the product sees
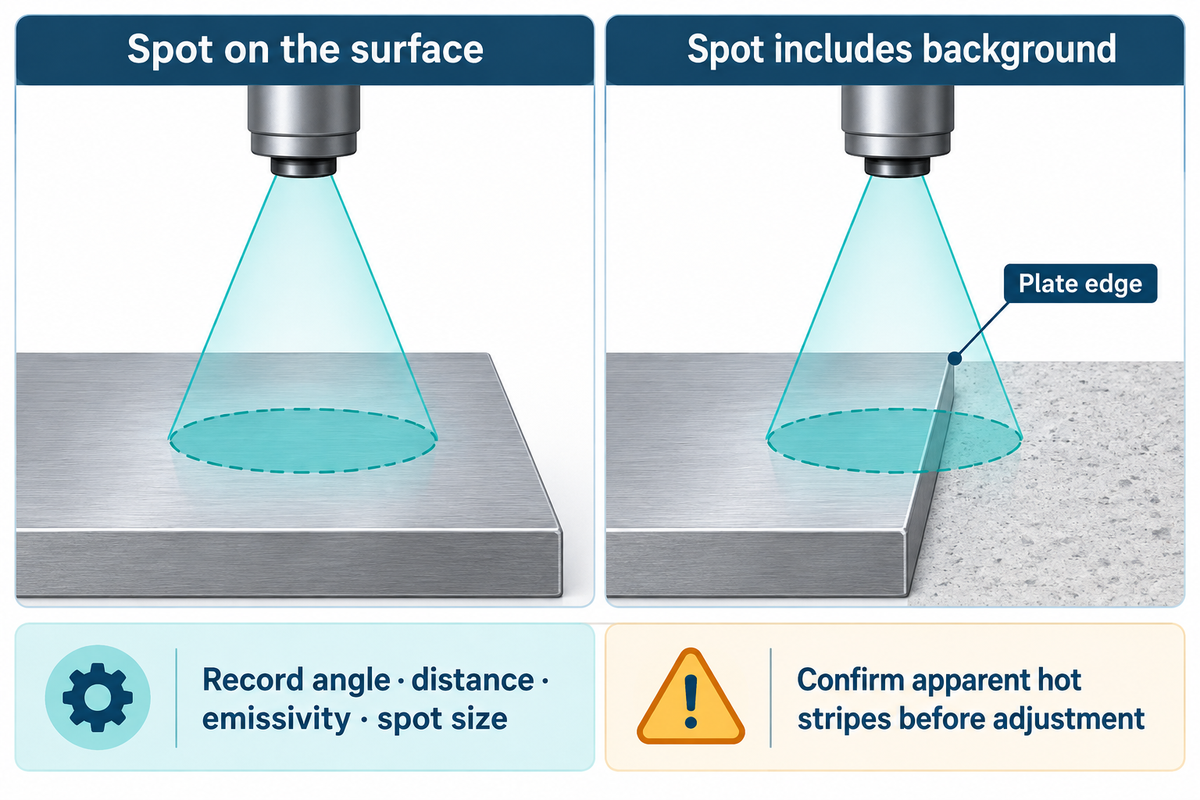
Compare measurements at the same surface positions and cycle stages. The setpoint of the controller describes the control target. It doesn’t determine the surface temperature at all points in contact with the sheet. Record the operating state of the equipment for each measurement. Comparison of a start up measurement to a stable production measurement isn’t valid.
Results of infrared measurements can be quite misleading. Angle, distance, emissivity, spot size, and the area the spot covers must be carefully documented. Some spots can include edges and/or background and give misleading comparisons. NIST’s infrared measurement uncertainty study identifies emissivity and spatial response functions as the two largest contributors to uncertainty in its metal-cutting study. The principle is relevant here; its numerical uncertainty is not a baking correction factor.
If an irregular temperature profile (i.e. hot stripes) is seen only in the thermal image, that irregularity must be confirmed by a method approved by the equipment manufacturer before any adjustment to the process is made. Never reach into moving equipment or remove guards to obtain a reading. A stopped and cooling plate is a different condition than one that’s under a production load.
The equipment geometry can heavily influence heat distribution. A thermal model of wafer plates hosted at a university examined the influence of the rear surface of the plate on the baking side. From a troubleshooting perspective, that means it’s better to check the actual surface rather than assume that a single sensor represents the surface; hardware changes still need a machine-specific engineering assessment.
Keep the comparison controlled
- Label samples by width and cycle.
- Measure at equivalent operating conditions.
- Check instrument settings before diagnosing a hot spot.
Avoid a misleading trial
- Do not change heat, speed and formula together.
- Do not treat an oven display as a full surface map.
- Do not compare warm texture with fully cooled texture.
Baking dwell time: test speed without hiding a feed problem
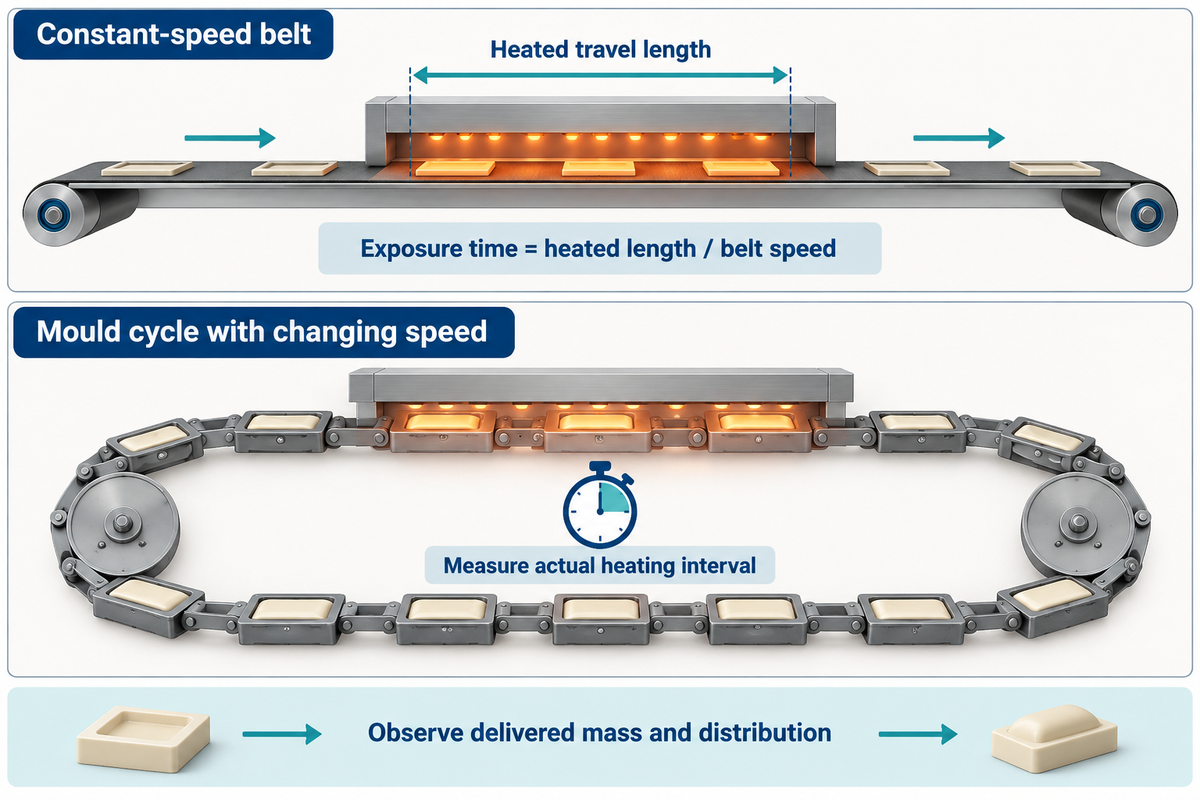
A trial to test how long a deposit remains on the plate can be useful after deposit consistency has been checked. Define the actual start and end of heating, then record how the equipment achieves that interval. Baking a surface in a mould circulating system may not respond the same way as a belt line system to the same change in the setting of the baking speed.
For a constant-speed belt, exposure time equals heated travel length / belt speed, using matching units. For example, heated travel length in meters / belt speed in meters/min = exposure time in minutes. A mould system with changing speed through its cycle requires measurement of the actual heating interval. Establish the time using the machine’s approved operating procedure.
Keep delivered mass and distribution under observation during the trial. If the feeder is speed-controlled, slowing the machine may change the deposit as well as exposure. An improved color result can’t be attributed to dwell alone. Record the color as well as acceptances, rejects and accepted throughput. Record accepted product in kg/h and reject rate alongside colour; a setting that produces fewer rejects but misses required output may be unsuitable.
Feuilletine crispness: separate bake defects from moisture pickup
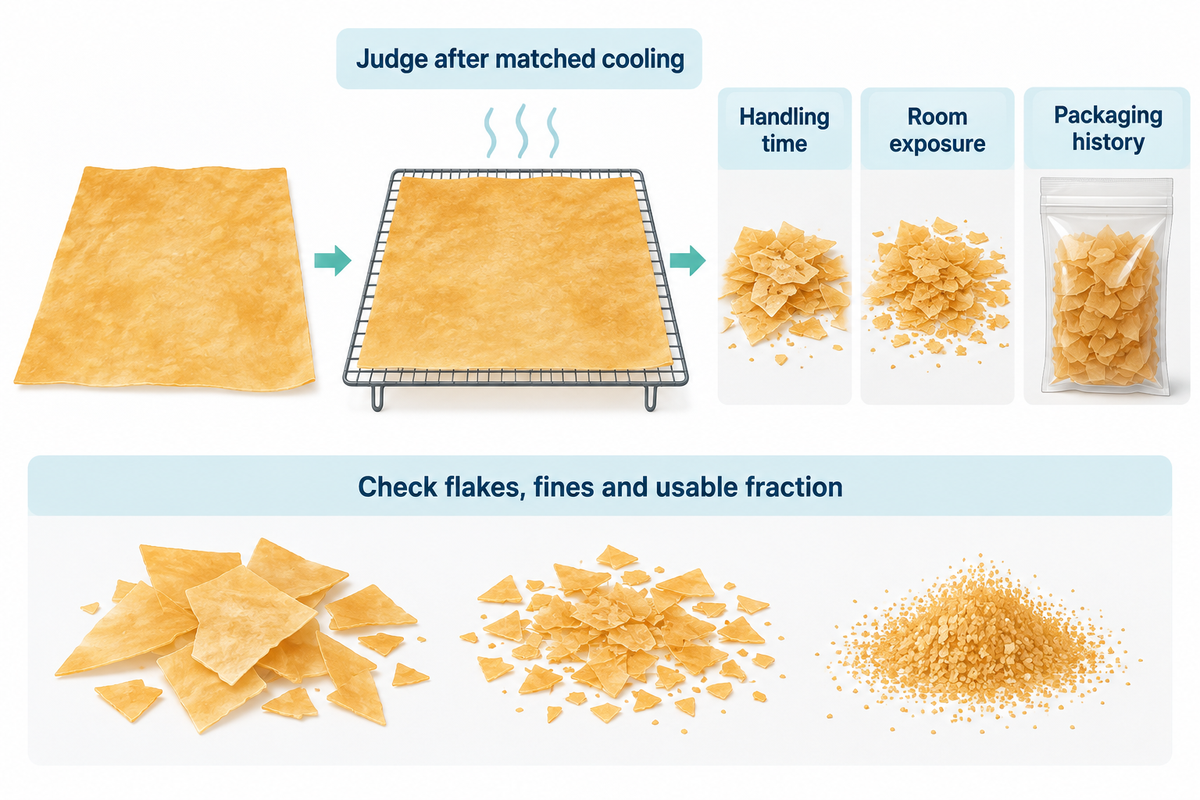
Judge crispness after a consistent cooling and conditioning time. If acceptable sheets soften later, compare handling time, room exposure and packaging history before increasing bake severity. Color and texture are related observations, but a darker appearance doesn’t establish a product’s moisture condition and safety.
Martínez-Navarrete and co-workers’ commercial wafer study reported fragile behavior below the studied moisture interval and rubbery behavior above it. Thus, focusing on the lowest possible moisture may not yield the desired result. Crispy flakes that survive the required handling and crushing may have already achieved the objective. Check if an otherwise acceptable biscuit sheet starts to crumble during transfers. Evaluate under the unchanged downstream conditions the acceptability of the flakes, the fines, and the usable fraction of the product.
Water activity and moisture content describe different properties. If the measurement of water activity is part of your specification, allow the samples to reach the required measurement conditions using an agreed method. The FDA’s technical explanation describes equilibrium vapour pressure and errors from temperature mismatch. The ISO 18787 catalogue identifies a food water-activity method; its public scope does not supply a crepe dentelle acceptance limit.
Retain the same cooling history for comparisons. A warm sheet assessed immediately, or a sample left uncovered and a sealed, retained sample, answer different questions. For a customer using feuilletine in dark chocolate or other dessert fillings, the acceptance test for the ingredient should be separated from the performance test in the final product. An ice cream inclusion needs its own application trial. Describe the required flavour as well as texture. Separate acceptance questions should be presented for buttery profile and crunchy bite.
Feuilletine trial cost: compare avoidable losses on one basis
The cost of avoided loss should be computed for equal production output, and any increase in operating cost should be subtracted. Keep the cost of the trial separate. Scrap, defined by the ASQ in its cost-of-quality categories as “Defective product or material that cannot be repaired, used, or sold,” should be evaluated differently from cost of recoverable rework.
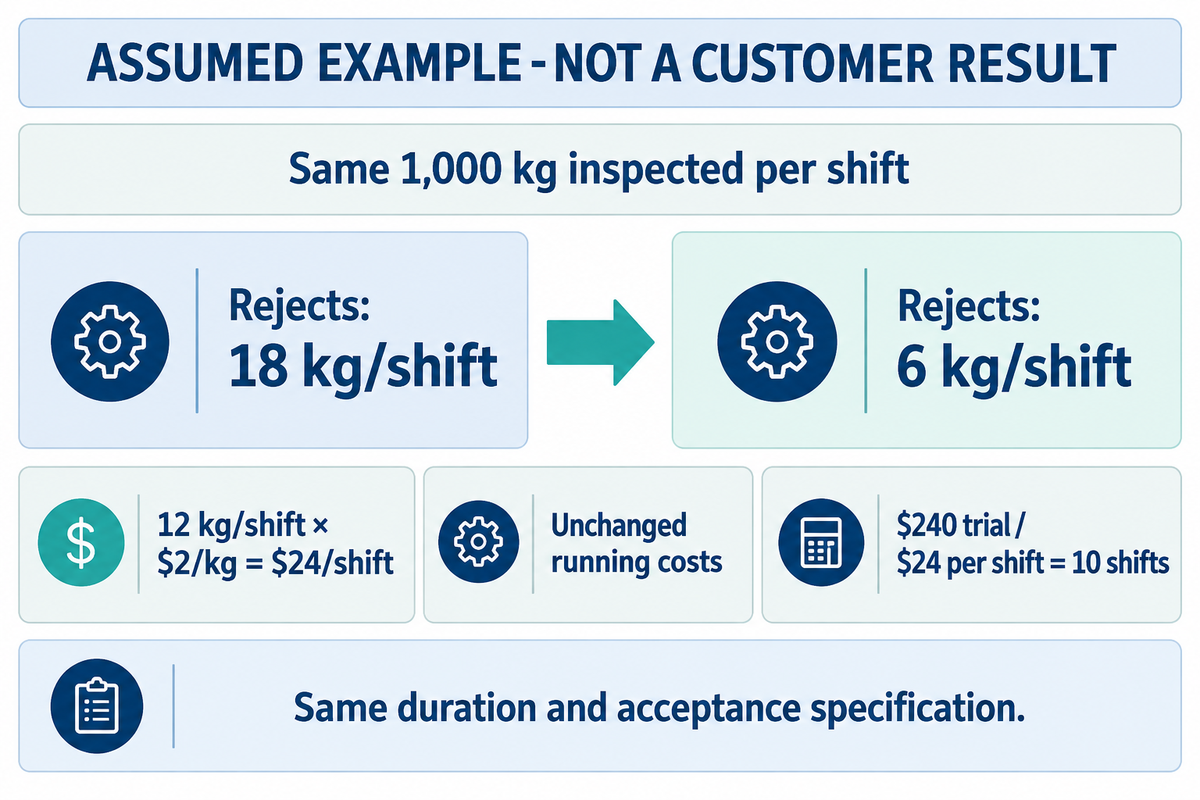
Assumed example, not a customer result: both conditions inspect 1,000 kg of post-bake product per shift, with the same shift duration and acceptance specification. Rejects fall from 18 kg/shift to 6 kg/shift, or from 1.8% to 0.6%. Accepted output rises from 982 to 994 kg/shift. At an assumed avoidable loss of $2/kg, the 12 kg/shift reduction is worth $24/shift before added operating costs.
With unchanged running costs and a one-off $240 trial, simple payback is $240 ÷ $24/shift = 10 shifts. If only 6 kg/shift is avoided, savings become $12/shift and payback becomes 20 shifts. Include extra energy, labour or maintenance when applicable. Don’t count the same recovered product twice as both avoided loss and additional sales margin.
The failure mode comparison is incomplete if rejects fall only because the line processes less product. Look at defect percent and saleable kg/h against demand. Do not accept the comparison if the line is only running smoothly. Use the feuilletine capacity planner to structure production and the energy cost estimator to evaluate measured utility.
Supplier handoff: define the feuilletine line and trial boundary
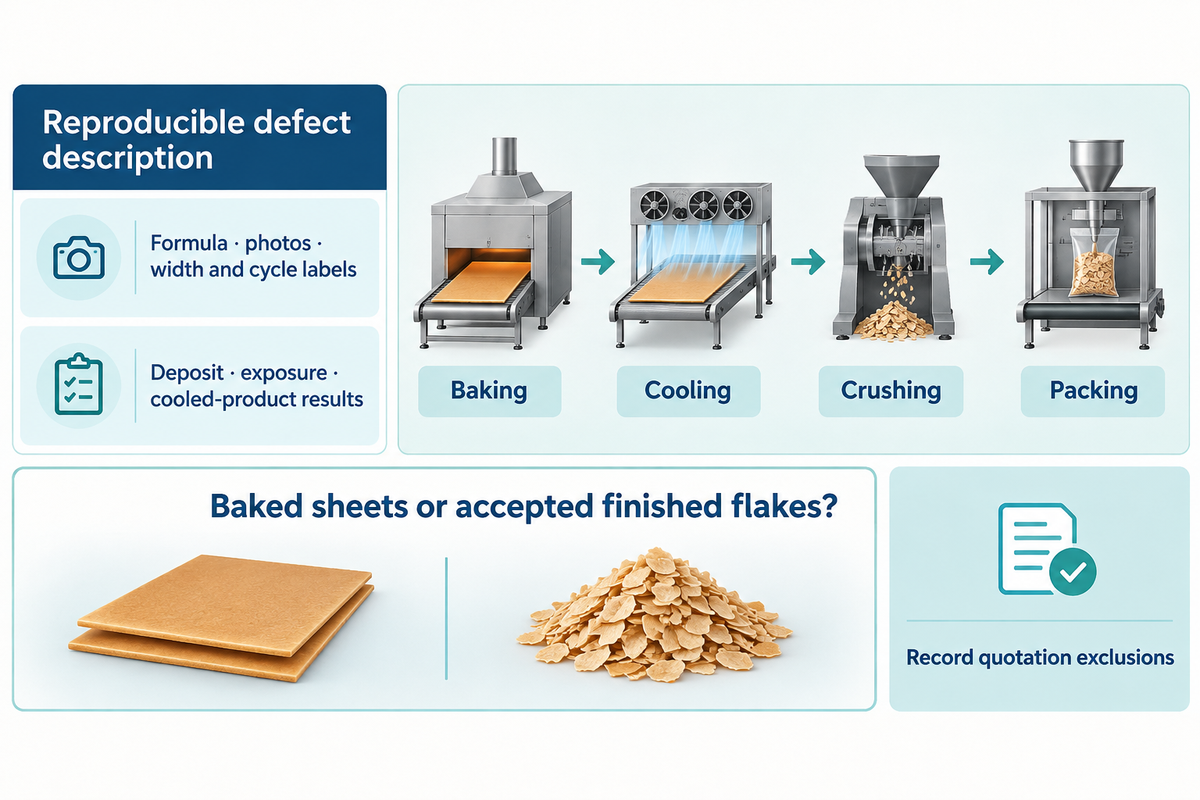
Send a reproducible defect description to the supplier. Include the formula revision, photos of the defects, width and cycle labels, deposit measurements, actual exposure and cooled-product results, the saleable output required, and what downstream conditions were held constant. These will help the supplier make a test proposal more than just a request for “more uniform baking.”
For a UDTECH feuilletine production line inquiry, distinguish the baking unit from cooling, crushing and packing scope. Agree on who will supply the trial ingredients, which measurements establish acceptance. Also, state whether the quoted throughput is based on baked sheets or accepted finished flakes. Record exclusions in the quotation.
Take this into the trial
Use the six checks to choose one controlled change, then judge colour, crispness, reject rate and saleable output together.
Feuilletine baking questions
Use these answers to frame a production trial. Recipe changes, storage conditions and the final application should each have a defined comparison.
How to fix lumpy crepe batter?
Lumpy production batter needs a check of ingredient addition, mixing and holding conditions before a recipe adjustment.
Start with the approved mixing sequence and compare the affected batch with an accepted one. Record flour lot, liquid temperature, mixing time and the point at which lumps appeared. Follow the plant’s approved screening or rework procedure where applicable. Extra mixing can change temperature and aeration, so verify deposit consistency afterwards rather than assuming a smooth appearance has restored the original process.
How do you make crepe Dentelle cookies?
Crepe dentelle cookies begin as thin baked layers; production for feuilletine focuses on consistent sheets that can be cooled and broken into flakes.
A domestic baking tray recipe is a different starting point from a continuous depositing and baking system. Establish the factory formula, deposit area, sheet thickness and release method through a controlled trial. Then evaluate the cooled product against the intended use. Home instructions involving a silpat, stencil or spatula can’t establish industrial capacity, bake time or a saleable flake yield for a particular machine.
Can they be frozen after baking and used later?
Freezing needs a product-specific handling trial because the packaging and return to use can affect condensation and crispness.
Use the plant’s approved storage and thawing procedure, then compare the product at its actual point of use. Record packaging, temperature history, exposure after opening and the resulting texture. A sample that remains dry while sealed may behave differently after handling in the production room. Include breakage and performance in the customer’s filling when those properties form part of the ingredient specification.
Can I reduce butter or add flour to correct an oily sheet?
A formula change should be a separate trial after deposit and release conditions have been checked.
Changing fat or flour alters the comparison. Record the revised recipe and reassess spreading, release, colour and cooled texture together.
Does a darker sheet prove the bake is complete?
Darker colour alone does not prove that a sheet meets its texture, moisture or food-safety requirements.
Apply the product’s agreed acceptance tests and validated process requirements. Compare colour under consistent lighting; don’t use it as a substitute for those checks.
How can feuilletine stay crisp after baking?
Feuilletine crispness depends on the cooled product and its exposure during handling, storage and use.
Compare samples with matched conditioning, then investigate where texture changes. Check time uncovered, packaging closure and the intended filling separately. Increasing bake severity is a poor first response when acceptable flakes soften only after storage.
Bring a repeatable bake fault to the equipment discussion
Share your sheet pattern, formula revision and required accepted output. UDTECH can discuss the baking unit and the surrounding line scope against that trial basis.
References & Sources
- Industrial wafer-plate material and baking study Köklü et al., Applied Sciences, 2025.
- Factors affecting wafer batter and wafer quality Dogan, 2006; publisher summary.
- Waffle production: influence of batter ingredients, Part I Huber and Schoenlechner, Food Science & Nutrition; online 2016, issue 2017.
- Uncertainty of temperature measurements by infrared thermography Lane et al., NIST, 2013.
- Wafer baking plate thermal modelling Carzino, Stanescu and Errera, Seatific, 2022; abstract.
- Water plasticization of commercial wafers Martínez-Navarrete et al., 2004; publisher summary.
- Water Activity (aw) in Foods FDA technical guide, 1984; measurement concepts.
- ISO 18787:2017, Foodstuffs, Determination of water activity ISO public catalogue.
- Cost of Quality American Society for Quality.
Our role in the bake trial
UDTECH supplies food-processing equipment. This guide combines published research with a proposed diagnostic record for equipment discussions. The cost example uses stated assumptions; operating limits and acceptance criteria belong in the trial agreement for the buyer’s formula and machine.