Get in touch with UDTECH Company

Reducing Wafer Roll Breakage

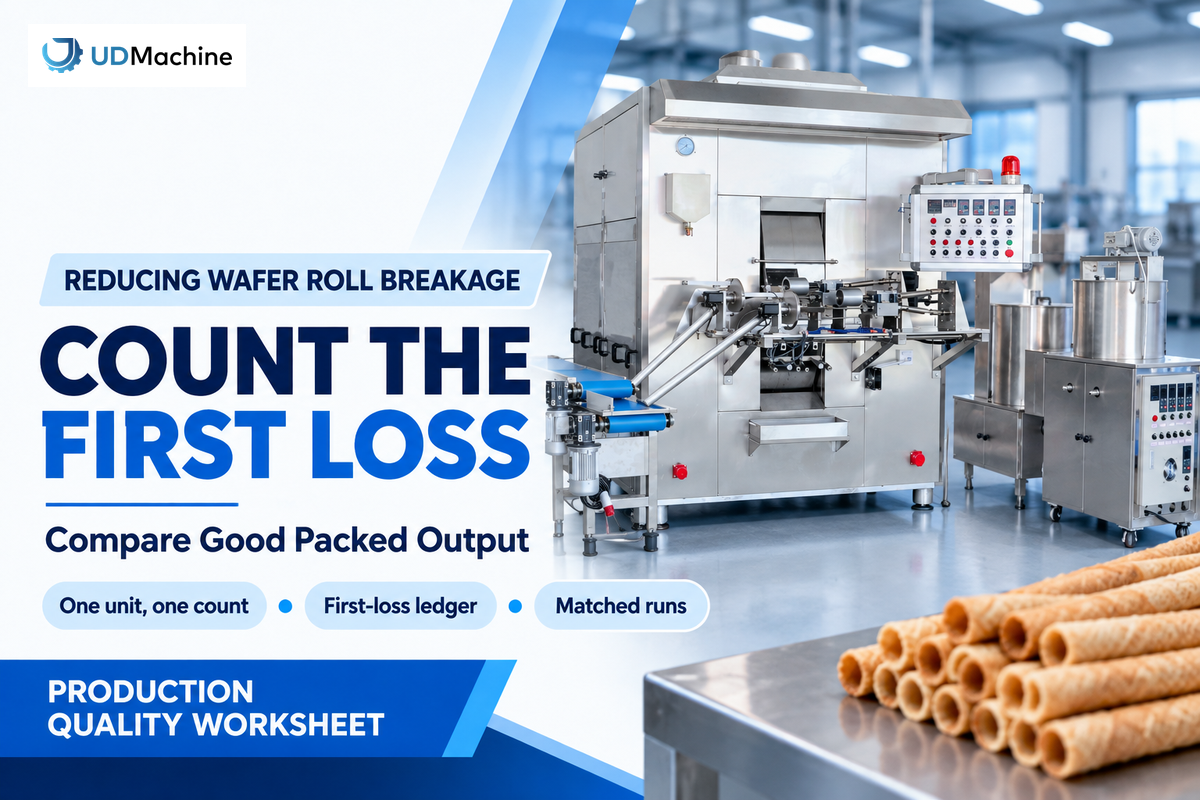
Production quality worksheet · By DD
To reduce wafer roll breakage, first make the loss count auditable. In wafer rolling production, a broken unit seen at a transfer may have weakened earlier, and a lower reject percentage can still produce less good packed output per hour. This guide builds a first-loss ledger, checks the arithmetic, and compares matched runs without promising a universal yield.
Scope: This is a public-data worksheet. The 10,000-unit example and matched runs are hypothetical. The existing egg-roll wafer process guide covers process principles, moisture and thermal mechanisms, and its fault matrix. This article focuses on reconciliation and comparison.
Define the unit before counting broken wafer rolls
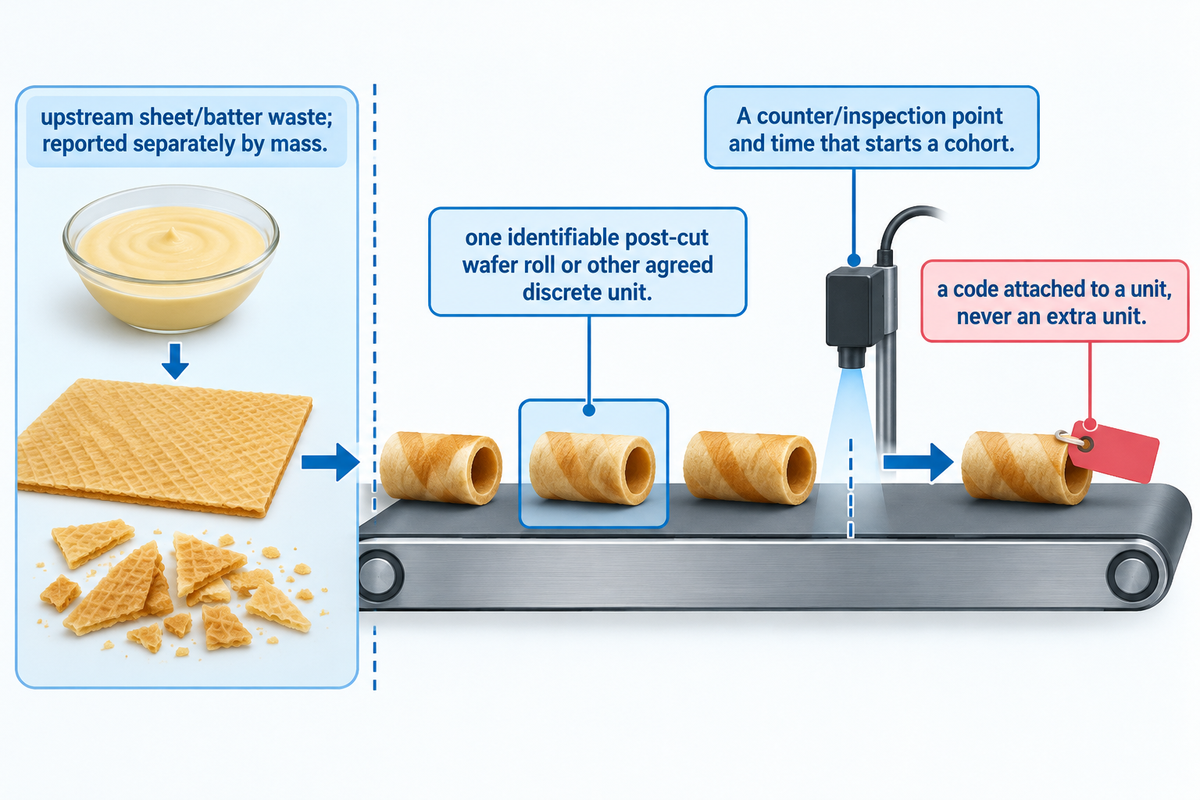
First, consider one countable production unit and one fixed limit. On a continuous sheet line, a practical limit may be after cutting, at a verified discrete-unit counter. Record units that are rejected and cross that limit; record other waste, if any, upstream by mass. If units that are post-cut cannot be identified reliably, then choose a limit downstream, and explain what loss upstream is outside the ledger.
That choice eliminates a false sheet-to-roll conversion. A continuous sheet, partial roll, fragment and finished packed roll are different observations. A single roll can also have several defects. For example, record a chip at the edge of the roll as a defect, not as an additional unit. Count the item only once; list defect codes separately. Use the agreed acceptance criteria to judge the quality of the roll. NIST’s proportion guidance makes the same distinction.
Minimum unit definition
- Unit: one identifiable post-cut wafer roll or other agreed discrete unit.
- Boundary: A counter/inspection point and time that starts a cohort.
- Defect: a code attached to a unit, never an extra unit.
- Excluded material: upstream sheet/batter waste; reported separately by mass.
Count each first loss once
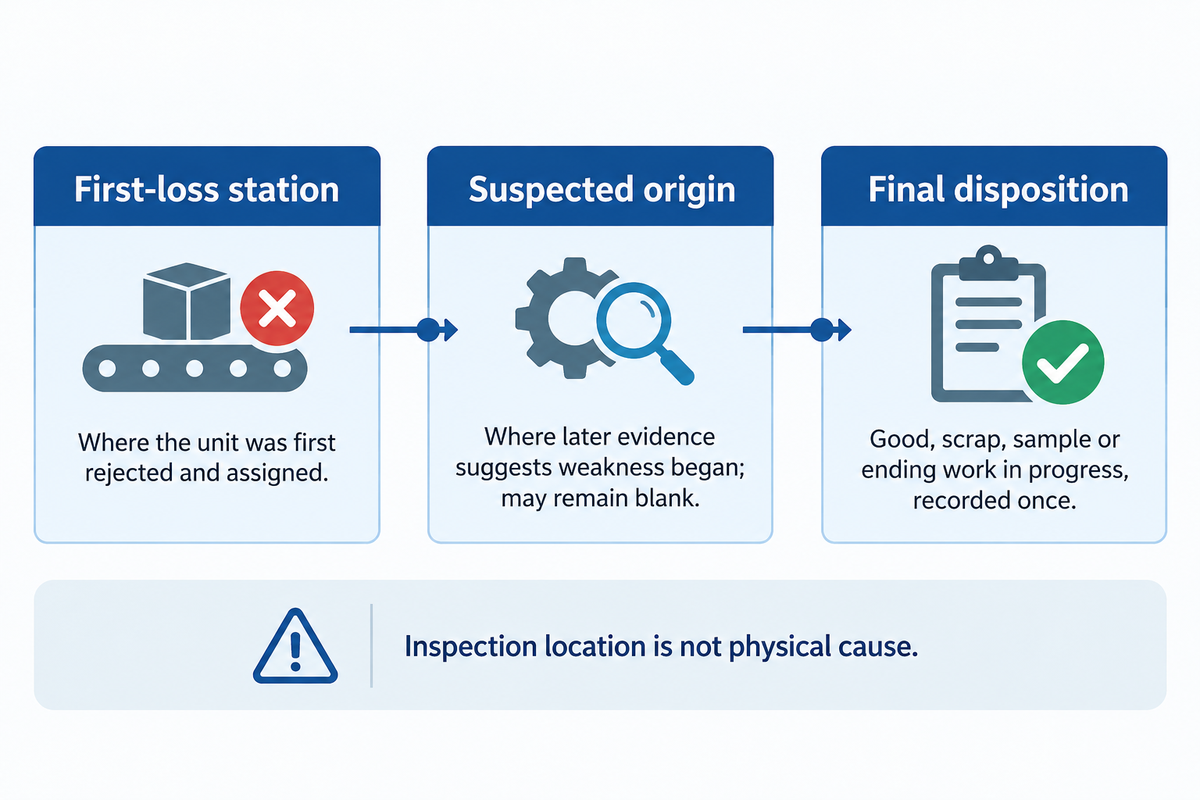
Assign one first recorded loss to each unit, at the first inspection point where the unit is rejected and its identity is still known. This is an accounting rule. The first entry location in the loss ledger is known, but the physical weakness may have begun at a different location. The first location of sensitive inspection of damage may be at the transfer station.
Inspection sensitivity can also change the apparent distribution of defects. A camera setting, lighting change or inspector change can increase or reduce detections without changing the material. Review product acceptance and rejection examples against an agreed reference when validating the count. It is good practice to document false rejects and missed defects when validating the count. Measuring misclassification error matters in inspection and quality-management research because inspection classifications can be wrong.
It is good practice to maintain two linked records when rework occurs. The first-pass defect event stays in the history even if rework changes the final disposition. The final disposition of a unit can be scrap or good, but not both. This example shows no rework.
First loss versus suspected origin
| Field | What it answers |
|---|---|
| First-loss station | Where the unit was first rejected and assigned. |
| Suspected origin | Where later evidence suggests weakness began; may remain blank. |
| Final disposition | Good, scrap, sample or ending work in progress, recorded once. |
Reconcile a 10,000-unit first-loss ledger
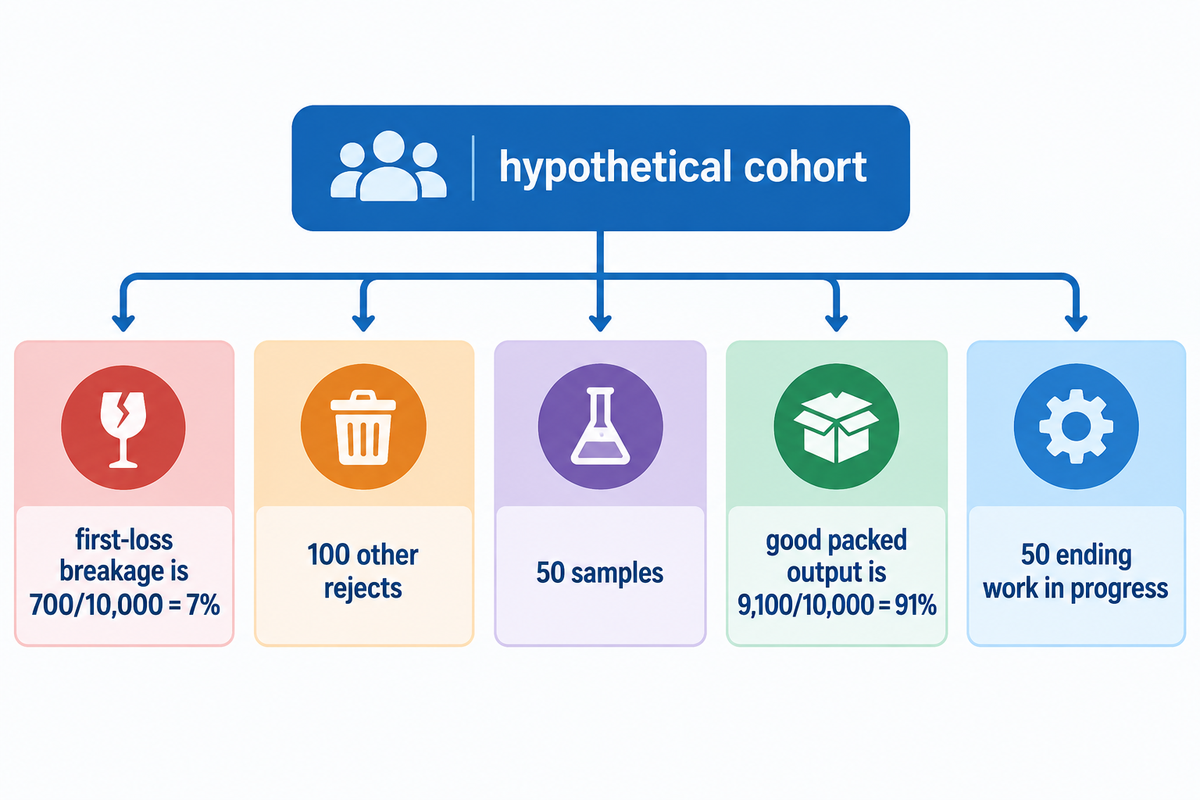
Every unit in a defined cohort should also have a documented outcome. The counting basis is the item, which may have several defects, as explained in the NIST definition of proportion nonconforming. This source supports the counting definition; the ledger values below are invented for illustration. Here’s a hypothetical example of a post-cut cohort with no opening work in process, and no rework. First-loss events are disjoint, while final outcomes account for good packed units, other rejects, samples and ending work in progress.
First-loss ledger · hypothetical cohort
| Event | Entering | First loss | Other removal | Onward | Evidence |
|---|---|---|---|---|---|
| Initial inspection | 10,000 | 120 | 0 | 9,880 | Counter + reject images |
| Buffer exit | 9,880 | 80 | 0 | 9,800 | Exit count + code |
| Transfer | 9,800 | 160 | 0 | 9,640 | Timestamped observation |
| Packer infeed | 9,640 | 240 | 0 | 9,400 | Infeed reject record |
| Final packing | 9,400 | 100 | 0 | 9,300 | Final reject record |
| Final disposition | — | 0 | 150 | — | Other rejects 100 + samples 50 |
| Good packed | — | 0 | 0 | 9,100 | Release checklist |
| Ending work in progress | — | 0 | 0 | 50 | End count + timestamp |
Balance: 120 + 80 + 160 + 240 + 100 + 100 other rejects + 50 samples + 9,100 good packed + 50 ending work in progress = 10,000. Samples are removed from the cohort but not necessarily classified as rejects.
If the balance is short, stop and figure out what caused the shortage: a missing count, a duplicate event or an unrecorded removal. Do not adjust breakage to hide unexplained units in a missing unit balance. A real plant may need opening work in progress, rework loops or a separate mass balance; add those fields explicitly.
Keep event order, counter source, observation time, operator or camera version, defect code and final disposition together so a CSV export can be checked independently. This way, when a CSV export is requested, the data can be verified.
Separate station loss rates from total breakage
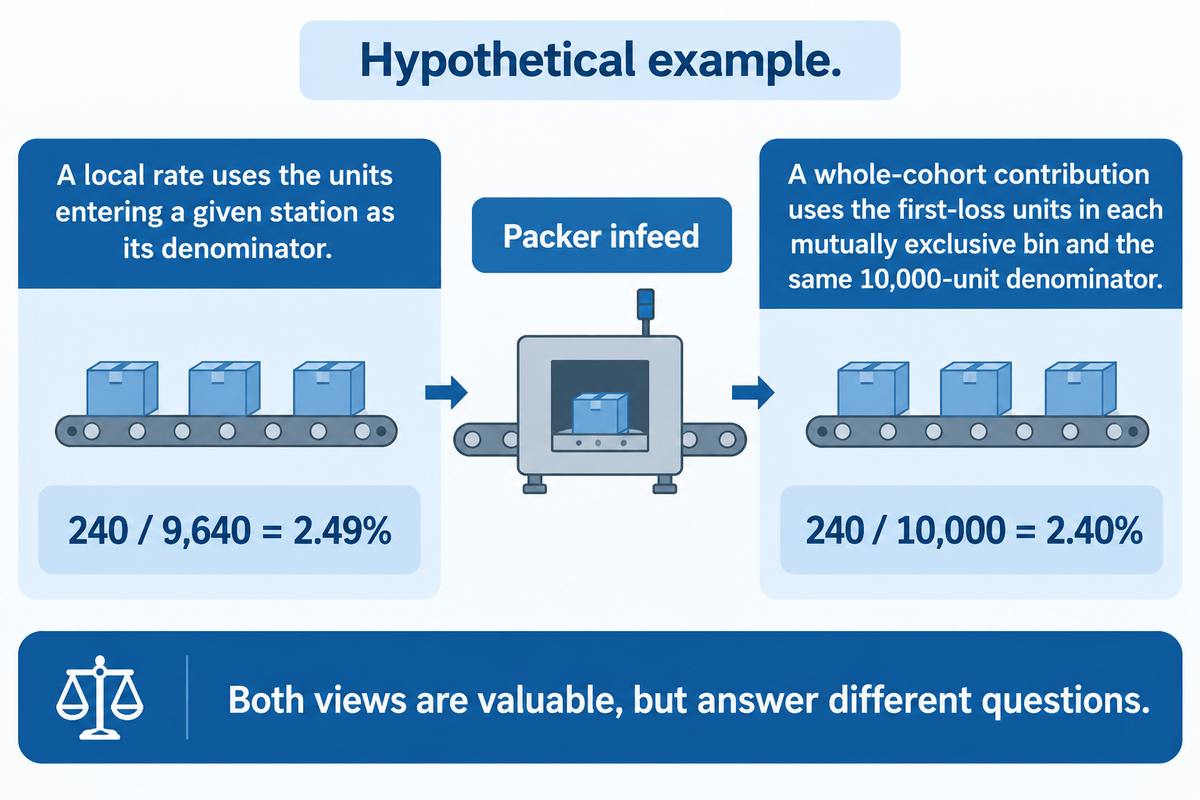
Use rates consistently. A local rate uses the units entering a given station as its denominator. A whole-cohort contribution uses the first-loss units in each mutually exclusive bin and the same 10,000-unit denominator. Both views are valuable, but answer different questions.
| Station | Local denominator | First loss | Local rate | Cohort contribution |
|---|---|---|---|---|
| Initial inspection | 10,000 | 120 | 1.20% | 1.20% |
| Buffer exit | 9,880 | 80 | 0.81% | 0.80% |
| Transfer | 9,800 | 160 | 1.63% | 1.60% |
| Packer infeed | 9,640 | 240 | 2.49% | 2.40% |
| Final packing | 9,400 | 100 | 1.06% | 1.00% |
On the common cohort, first-loss breakage is 700/10,000 = 7%. Good packed output is 9,100/10,000 = 91%. It isn’t 93%, because other rejects, samples, and ending work in progress remain in reconciliation. A proportion, according to NIST, is defined as nonconforming items divided by total items in the defined population; this ledger doesn’t claim to represent every single physical crack that has never been detected.
common-cohort contribution = station first-loss units / counted cohort units
Whole-cohort first-loss rate = sum of disjoint first-loss units / counted cohort units
Whole-cohort first-loss rate = sum of disjoint first-loss units / counted cohort units
Compare matched runs using good packed output
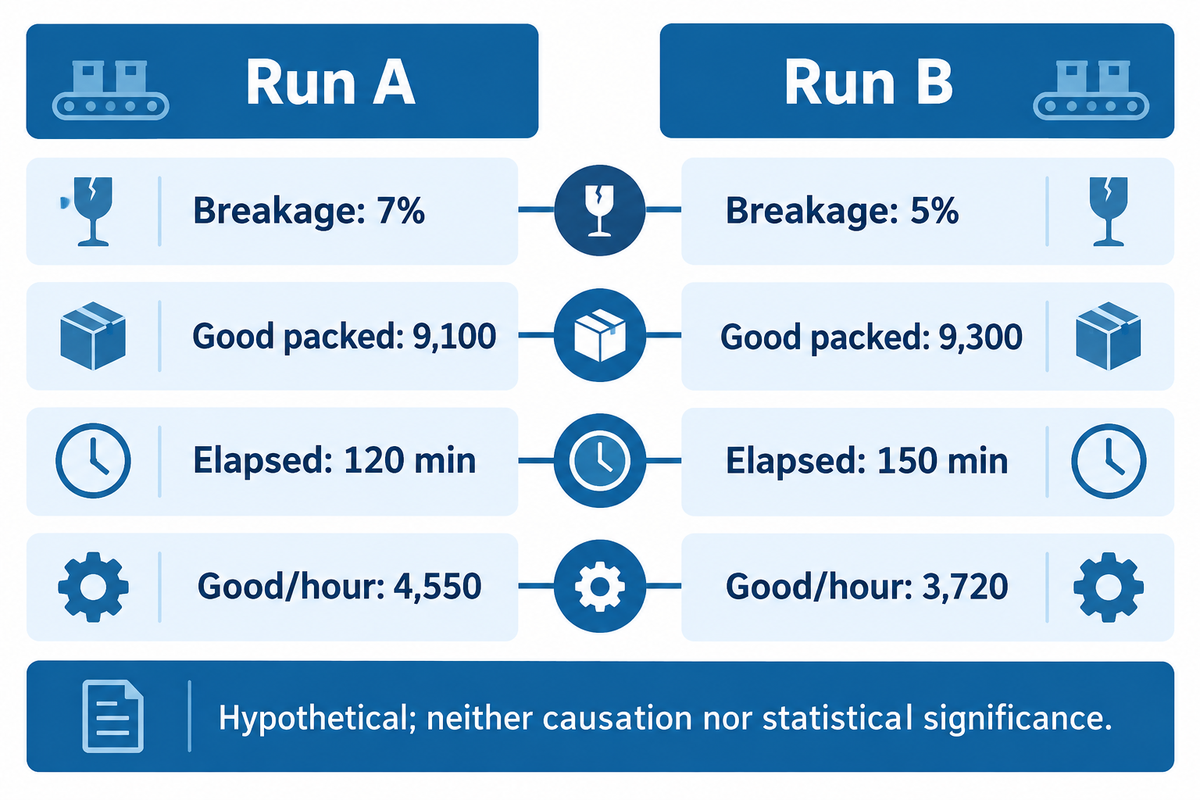
Judgment should be based on the useful endpoint that the buyer is interested in. Report broken units, good packed units and the elapsed time for the same product and inspection rule. For this comparison, define the operation rate as good packed units per elapsed hour. A lower breakage rate is compatible with lower good packed output per hour if the improved run takes longer.
Matched-run counterexample · hypothetical
| Run | Counted | Broken | Other rejects | Samples | Ending WIP | Good packed | Elapsed | Good/hour |
|---|---|---|---|---|---|---|---|---|
| A | 10,000 | 700 | 100 | 50 | 50 | 9,100 | 120 min | 4,550 |
| B | 10,000 | 500 | 100 | 50 | 50 | 9,300 | 150 min | 3,720 |
Read it carefully: Run B moves breakage from 7% to 5%, but its good packed rate is lower because elapsed time is longer. These values are hypothetical and establish neither causation nor statistical significance.
Match recipe, dimensions, filling, lot conditions, inspection settings, startup inclusion, end-point, and process lag. NIST’s design guidance recommends blocking important nuisance factors and randomizing the rest. For a short trial, describe the comparison as a bounded observation unless the design supports a stronger conclusion.
Agree on release criteria. Breakage may be one criterion; dimensions, filling, package condition and sensory checks may also apply. The “good” endpoint happens at the point of packaging. Later retention or handling observations need their own timestamp and disposition; there is no universal storage hold for every product.
Turn the loss pattern into a bounded trial
Diagnostic leads must be based on the first-loss evidence, not treated as proof of cause. Evidence of 240 first-loss units at packer infeed is a diagnostic lead; it does not prove that packer infeed is the cause of out-of-spec product. Use the inspection rule to check the upstream and downstream interfaces for intact units. Keep the first-loss entry in the historic ledger and only update suspected-origin when there’s evidence to support it.
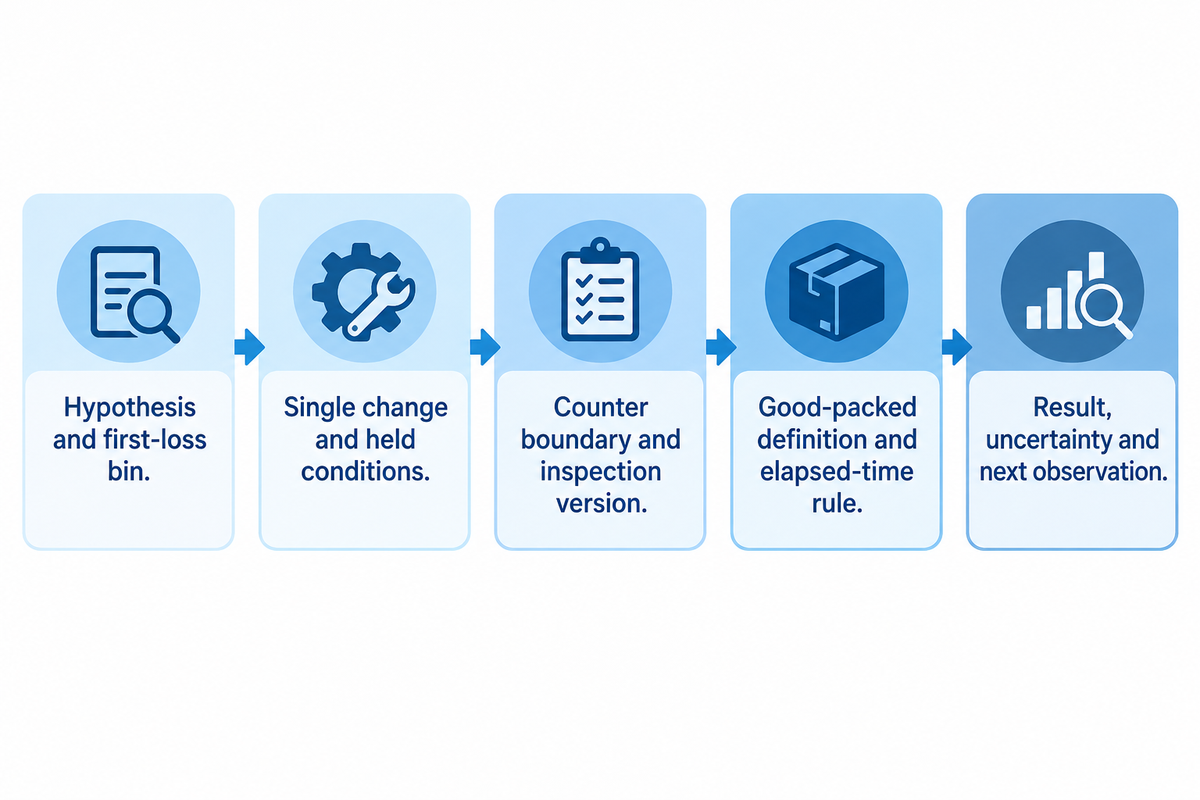
A bounded trial records one hypothesis, one change, held conditions, a defined sample boundary, an observation lag, an agreed criterion and the result. Use this record to evaluate measures to reduce wafer roll breakage. Normal safe access is appropriate for observation; intrusive changes follow site procedures. Findings in a flat-wafer baking study describe temperature, thickness and color, but do not prove thresholds for food wafer breakage.
Trial record fields
- Hypothesis and first-loss bin.
- Single change and held conditions.
- Counter boundary and inspection version.
- Good-packed definition and elapsed-time rule.
- Result, uncertainty and next observation.
Send a supplier an acceptance evidence pack
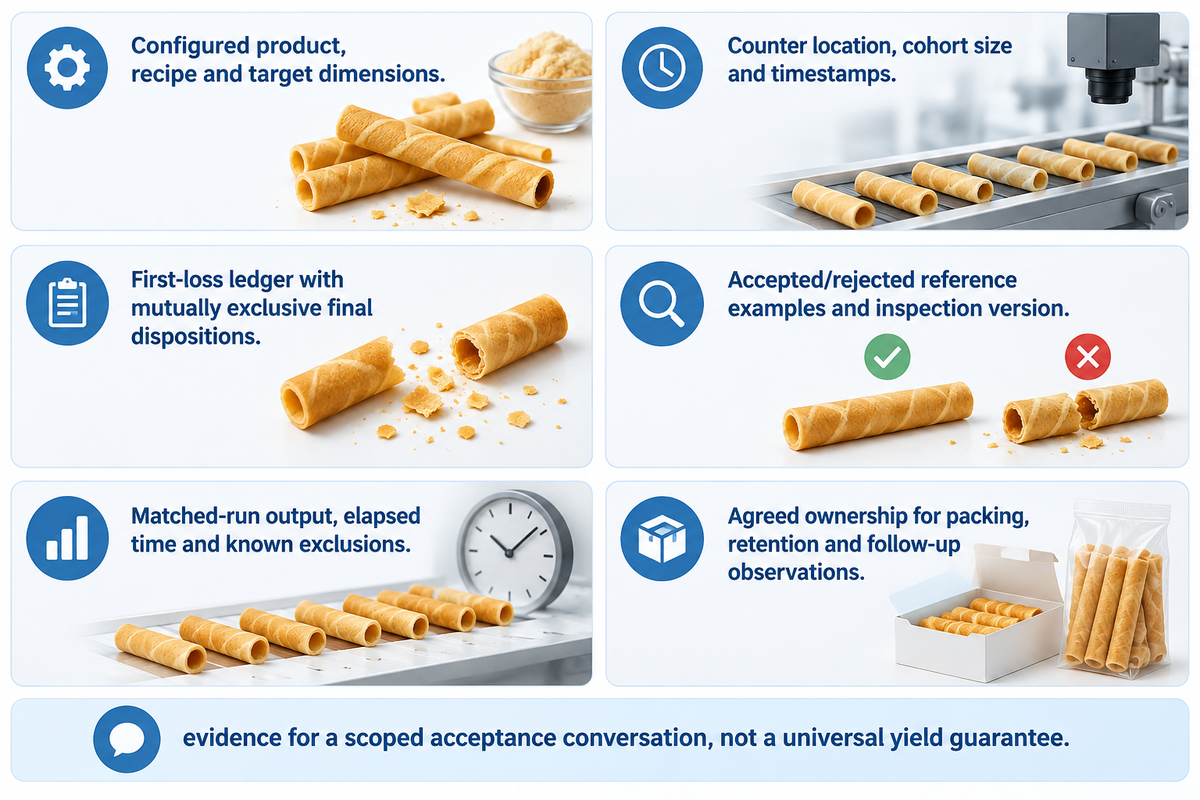
A supplier discussion becomes useful when both sides can reproduce the count. Send the configured product, count boundary, dated ledger, defect images, inspection method, matched-run table, changes made and responsibility for downstream packing. Agree on what “good packed” means before comparing results. This is evidence for a scoped acceptance conversation, not a universal yield guarantee.
PMMI’s factory-acceptance guidance emphasizes clear criteria and communication among the parties. NIST identifies the distinction of acceptance sampling versus estimating the full quality of the lot. Don’t adopt a sample size, or a 97-98% target from another process, without a documented risk basis.
For UDTECH’s public wafer-roll machine family, the UDTECH company profile and wafer-roll machine page describe the public configuration context, not a buyer specific packed yield. The shift-output planner can help you estimate rated output for planning. Put your recipe, dimensions, counter location and release criteria in your request, and discuss the boundary using the project inquiry form.
Supplier pack checklist
- Configured product, recipe and target dimensions.
- Counter location, cohort size and timestamps.
- First-loss ledger with mutually exclusive final dispositions.
- Accepted/rejected reference examples and inspection version.
- Matched-run output, elapsed time and known exclusions.
- Agreed ownership for packing, retention and follow-up observations.
Frequently Asked Questions
Can I count fragments as broken wafer rolls?
Keep fragmented units distinct until their identity is verified. If it can’t be traced to a single counted roll, it should be kept in a separate fragment or mass record. Don’t assume a fragmented mass is equal to a counted roll.
Should reworked rolls count as good output?
Keep first-pass quality and final disposition separate. A reworked unit can be recorded once in first-pass defect history and once as its final good or scrap disposition. Whether rework is permitted is a site-specific food-safety and quality decision.
Can I add breakage percentages from different stations?
Not if local denominators are different. Show local rates, and then calculate disjoint first-loss contributions over the same cohort. The total is meaningful only if each unit is assigned once.
Is a lower breakage rate always a better run?
No. Check good packed output, elapsed time, other rejects, samples, work in progress and the release criteria. Match recipe, inspection settings and lot conditions, then compare again when the decision needs to be made.
What if I cannot count units before rolling?
Move the start boundary to the first downstream point that can be counted reliably. Report sheet and batter loss in their own mass balances. Use a sheet-to-roll conversion only if it’s been verified for that product and line; don’t infer it from the rated machine output.
References & Sources
- NIST/SEMATECH e-Handbook, Proportions — definitions of items, defects and denominators.
- NIST/SEMATECH e-Handbook, Blocking — nuisance-factor control and randomization.
- NIST/SEMATECH e-Handbook, Acceptance Sampling — lot accept/reject scope.
- First Pass Yield from the ASQ glossary refers to the first-pass quality and rework boundary.
- University of Waterloo repository, binary inspection study. Binary inspection study — measurement-agreement caveat.
- Manubes quality conversation, OEE – quality and useful output distinction.
- Applied Sciences, industrial flat-wafer study — method-boundary context.
- PMMI updated factory acceptance test guidance criteria and responsibility discussion.
- UDTECH wafer-roll machine product page — current public configuration scope.
Public-data note: this article does not report a UDTECH customer yield, universal breakage threshold or guaranteed improvement.